DX1 is built around inventory management, retail sales, technician data, minmaxes, and many other valuable data points. Learning how to use that data is critical to identifying areas where your dealership can improve, where you're strong, and where you can market to. This knowledge comes through reporting. DX1 provides powerful reporting tools that allow you to access, customize, and schedule reports to help you make better business decisions.
In this document, we will cover the following topics
1. How to access reports in DX1
2. Understanding the report indexing system
3. How to mark reports as favorites
4. How to schedule reports
5. How to copy a report
6. How to edit custom reports
7. Don't miss reports by the department
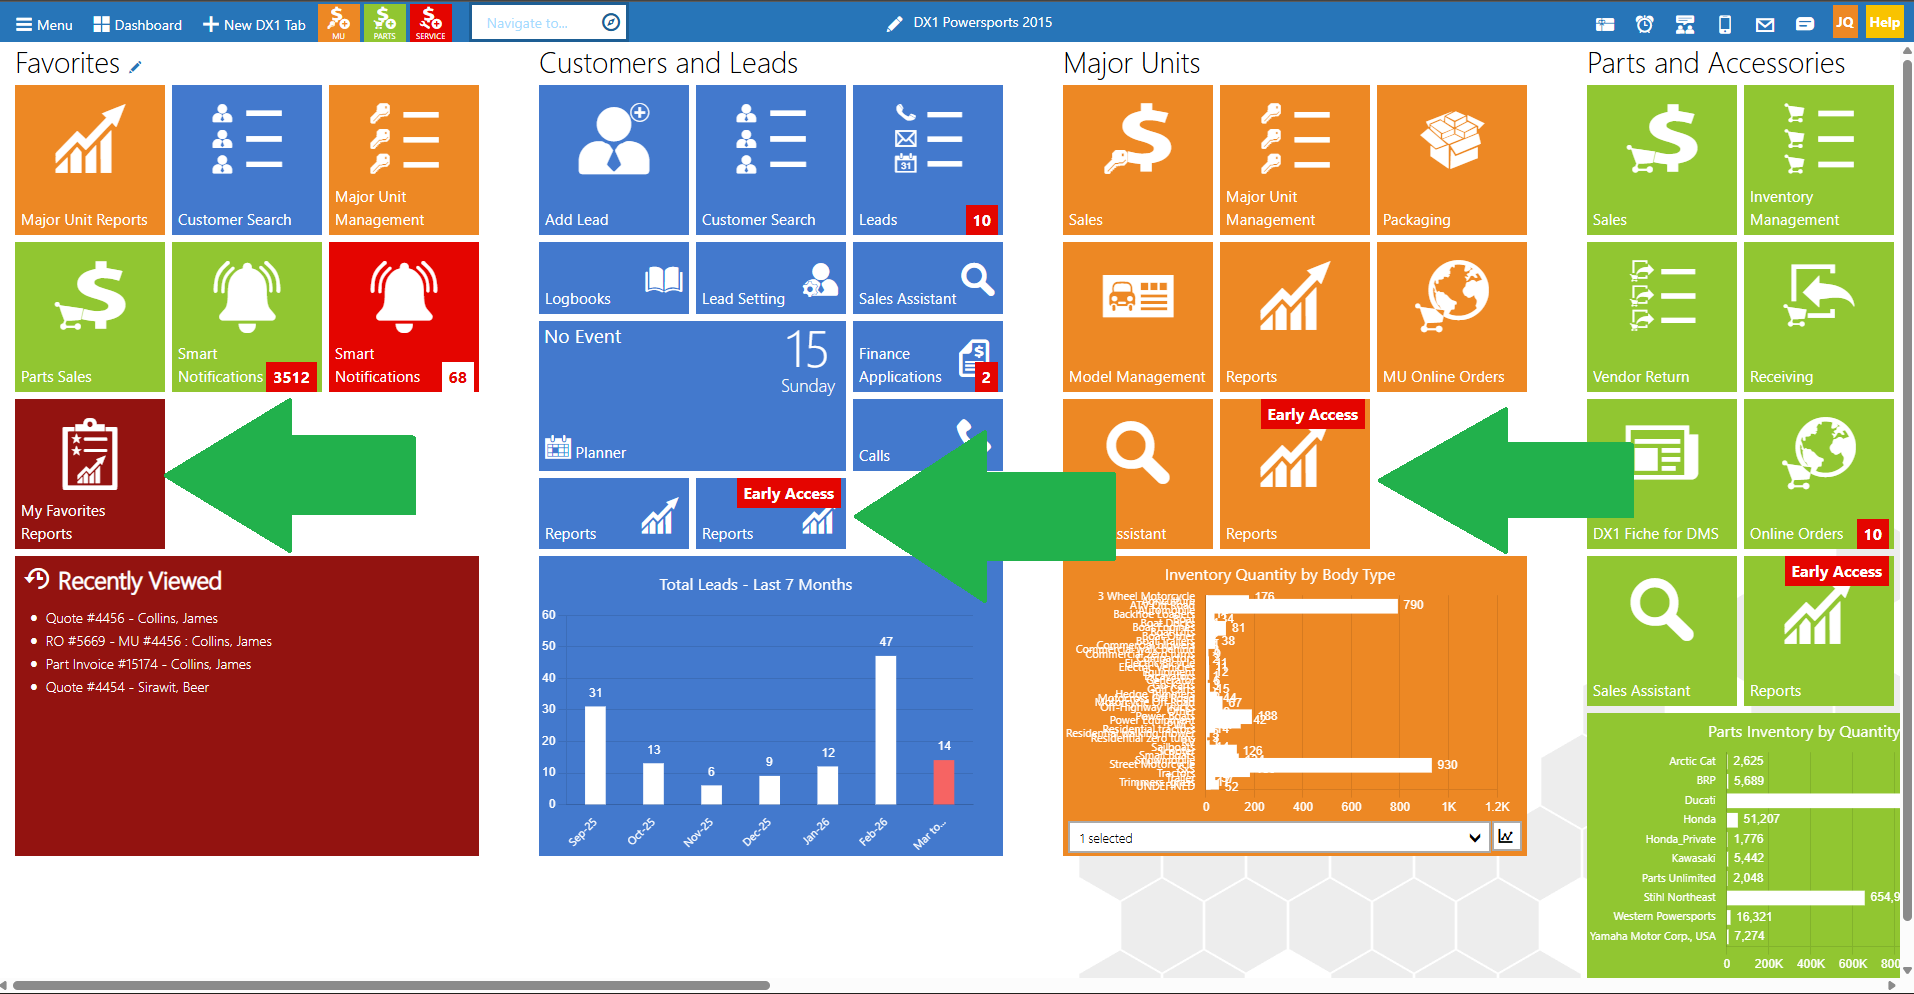
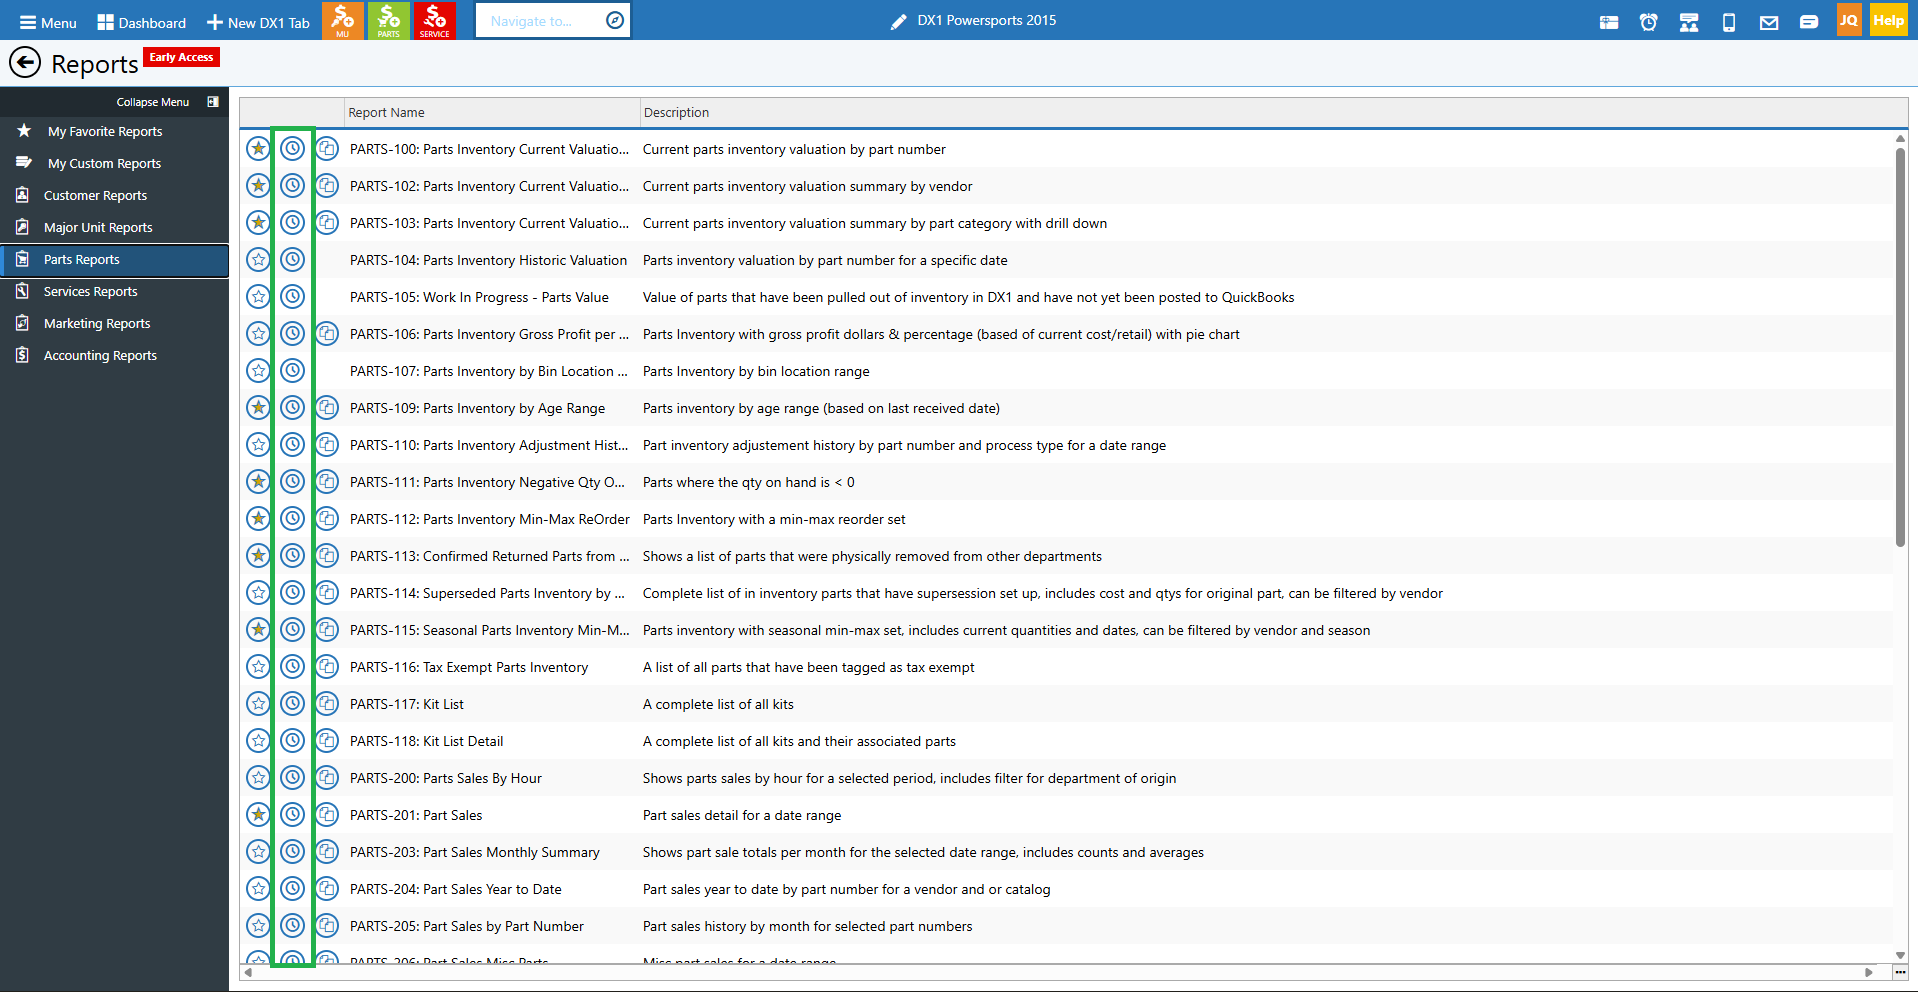
1. How to access reports in DX1
• Every module in DX1 has a Reports tile that will take you to the reporting interface.
• It doesn't matter which module you click the Reports tile from; you will land on a list of reports.
• When you land on the reports page, you can navigate to any other report area using the collapse menu on the left side of the screen.
• For example, if you're in Customers but need to get to Parts reports, you can click the collapse menu and select Parts.
• From the dashboard, if you have your favorites configured, you'll see a My Favorites report option that can navigate you directly to your favorite reports.
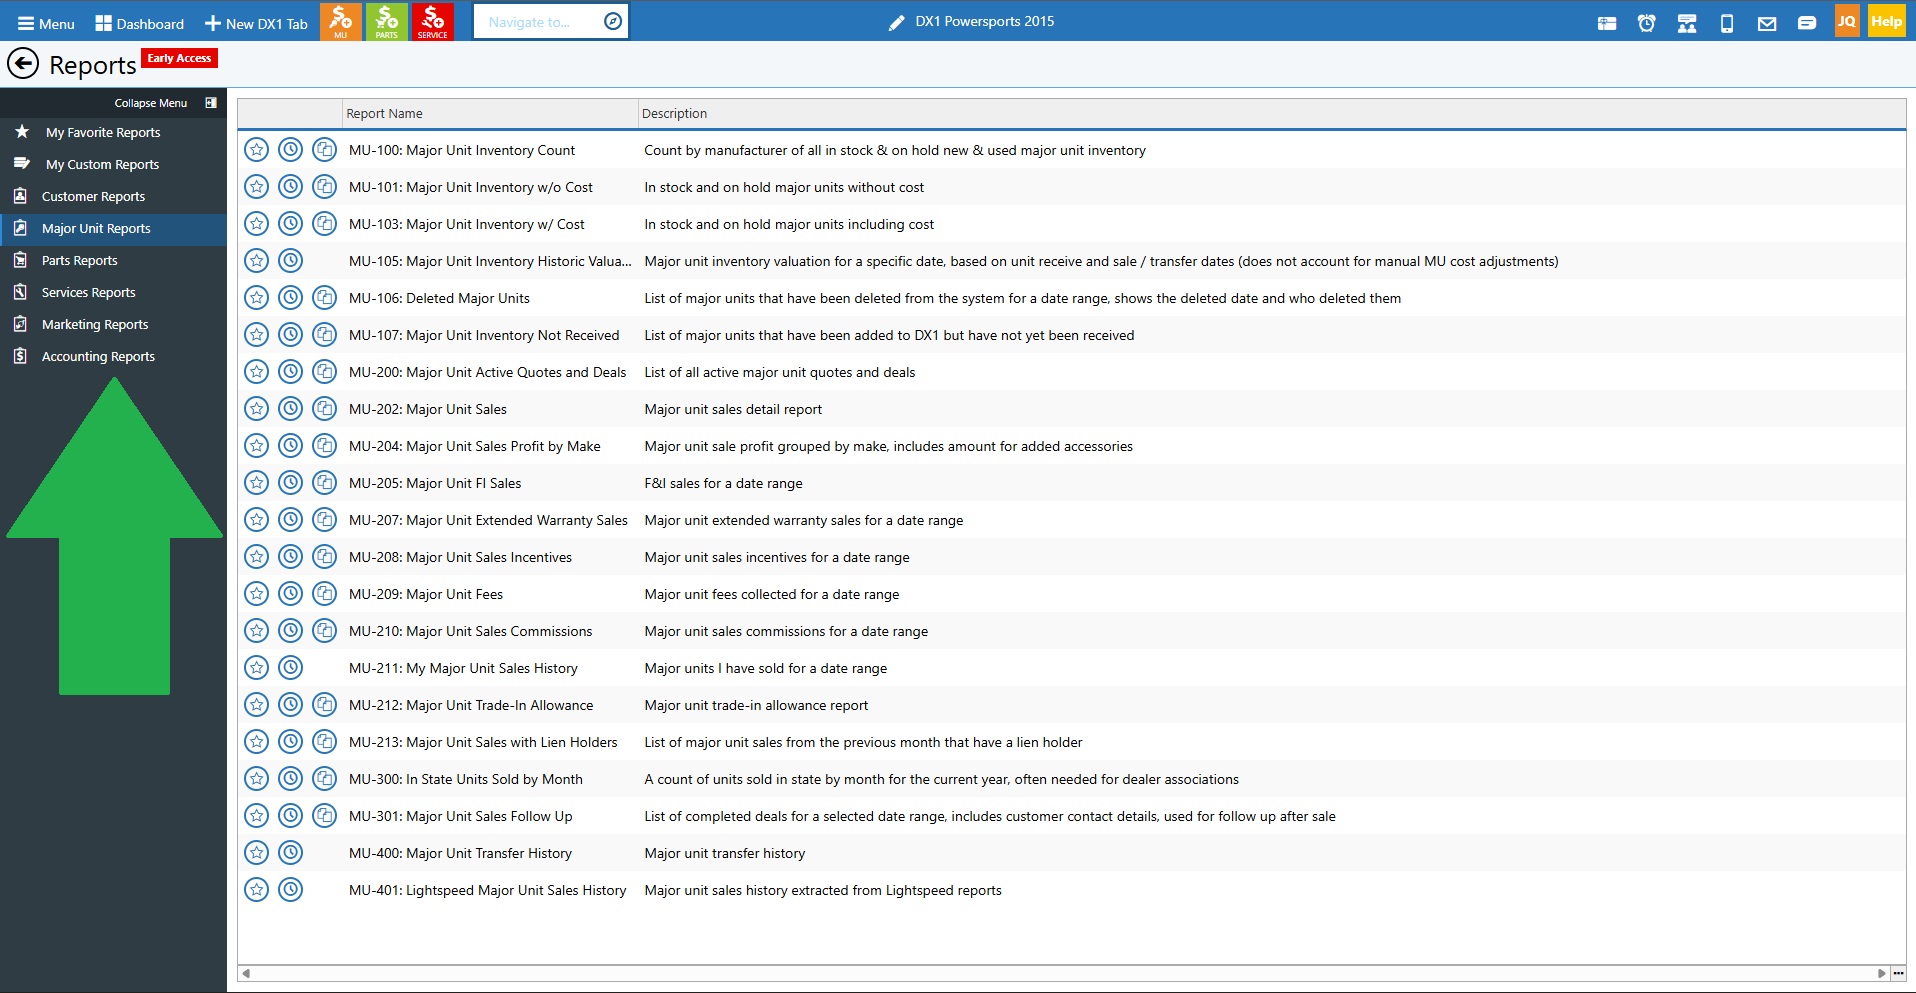
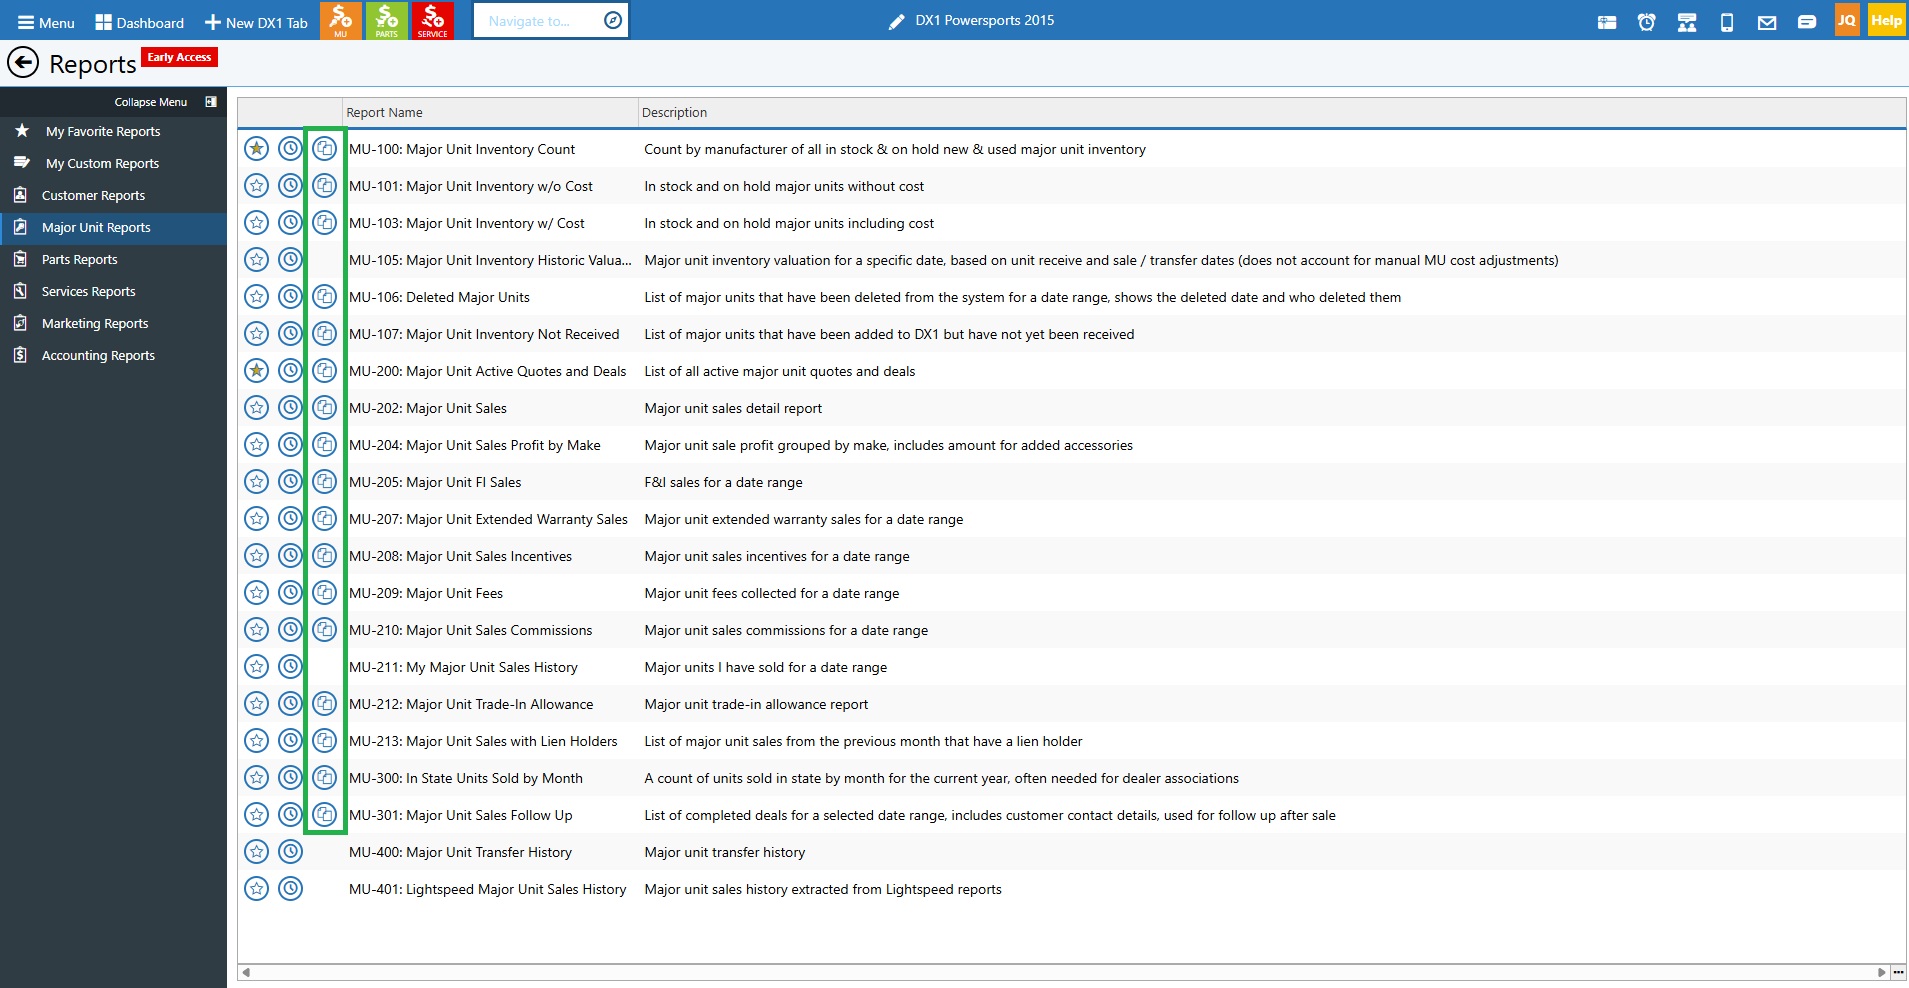
2. Understanding the report indexing system
• DX1 uses an indexing system for all reports across different areas.
• Each report has a number code, for example, MU-100 for a major unit report.
• The numbers are themed by category in each area:
- 100s are typically for inventory reports
- 200s are typically for sales reports
- 300s and higher go into other specialized areas
• This indexing system is consistent across all departments (Customers, Major Units, Parts, Service, etc.).
• Understanding this system can help you quickly locate the type of report you're looking for.
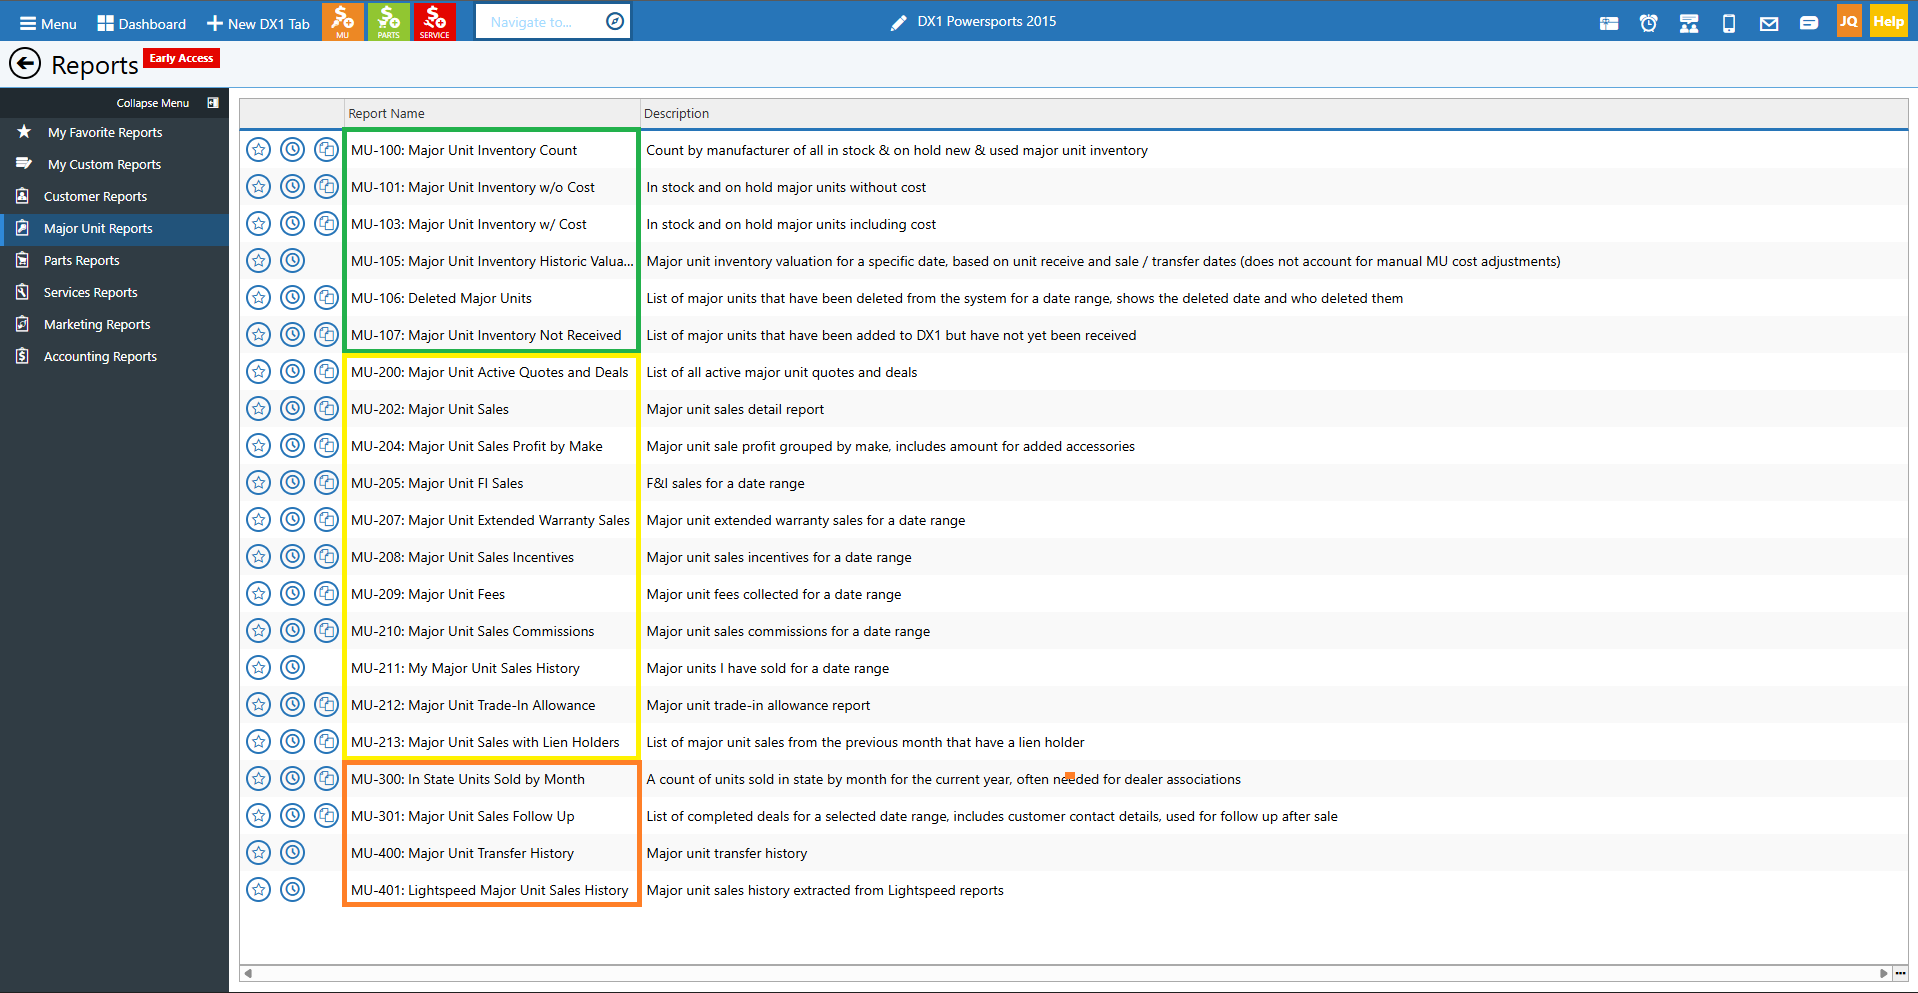
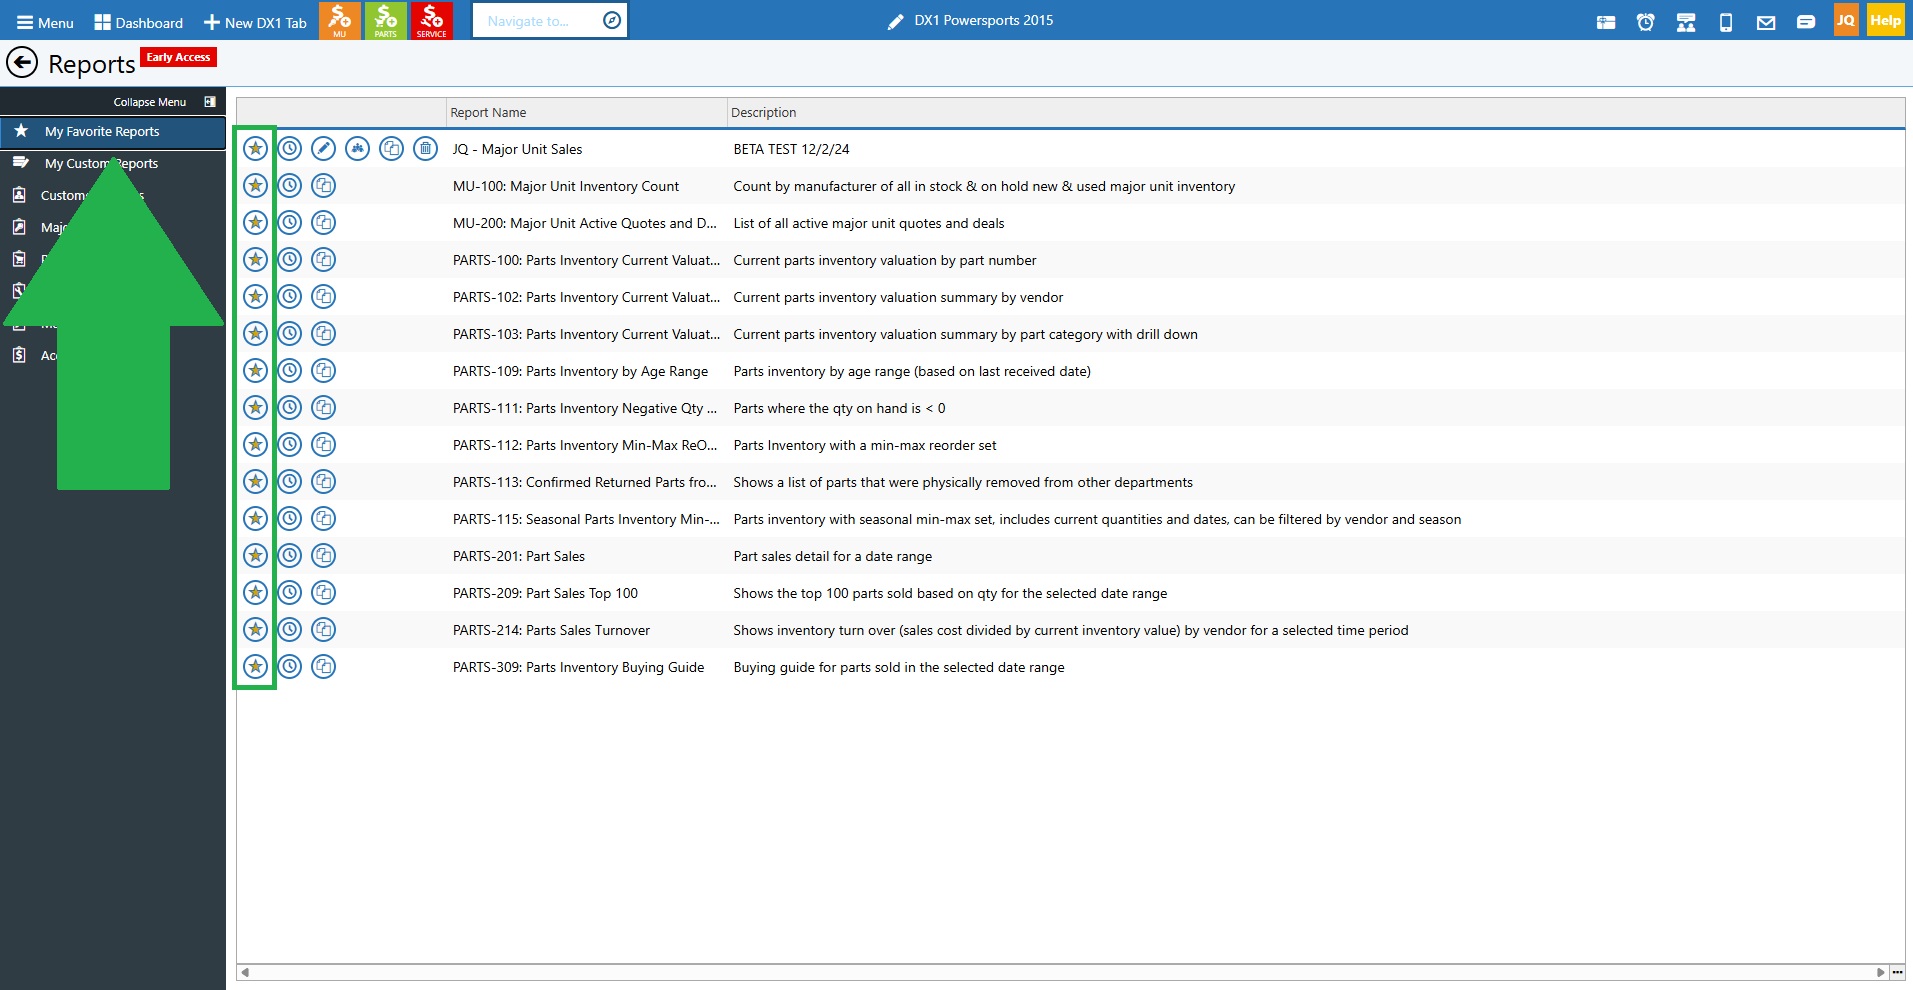
3. How to mark reports as favorites
• In each report area, you'll see a star icon next to each report that allows you to mark it as a favorite.
• Find reports that you use frequently in any area (Customers, Major Units, Service, Parts, etc.) and click the star icon.
• Once marked as favorites, all of your favorite reports from different modules will appear together in the My Favorites section.
• This eliminates the need to navigate from module to module to access your most-used reports.
• To unfavorite a report, click the star icon again from the favorite screen, and it will be unmarked and sent back to the normal list.
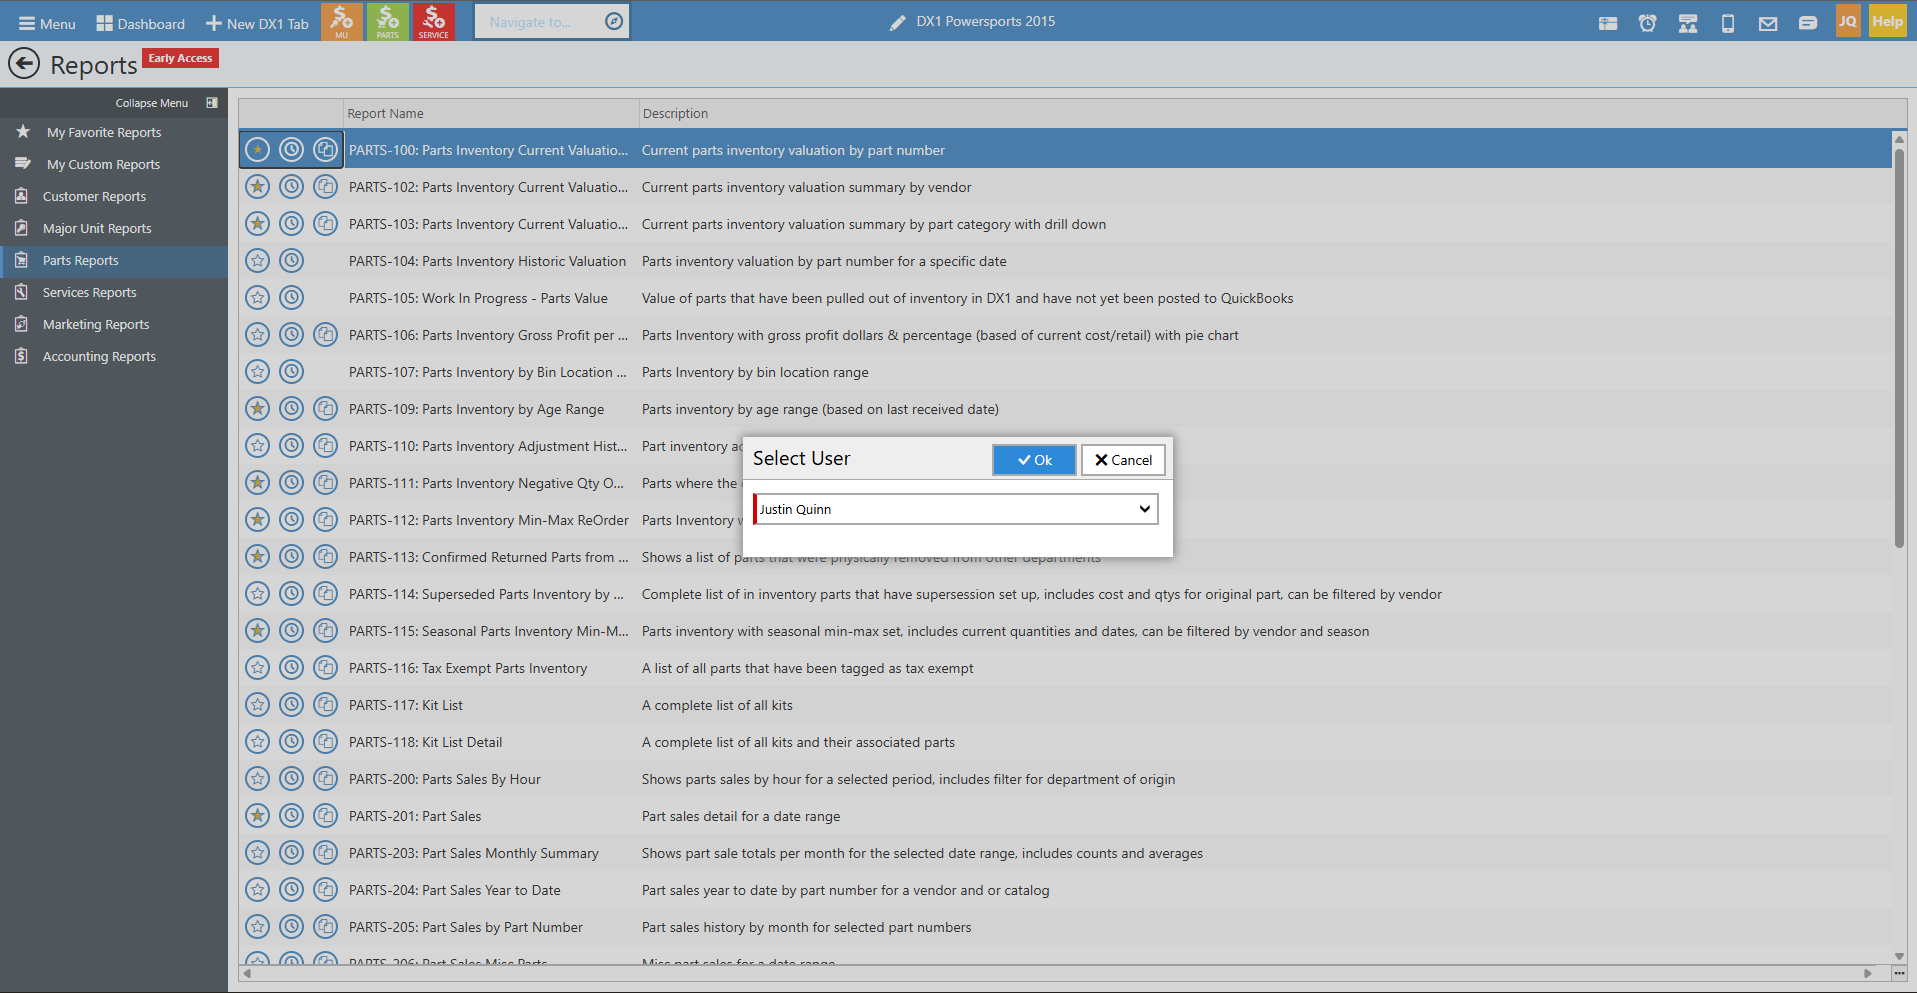
4. How to schedule reports
• You can schedule reports to be sent to you or others on a regular basis via email.
• To schedule a report, find the report you want and click the schedule icon (calendar icon).
• Click OK to proceed to the scheduling options.
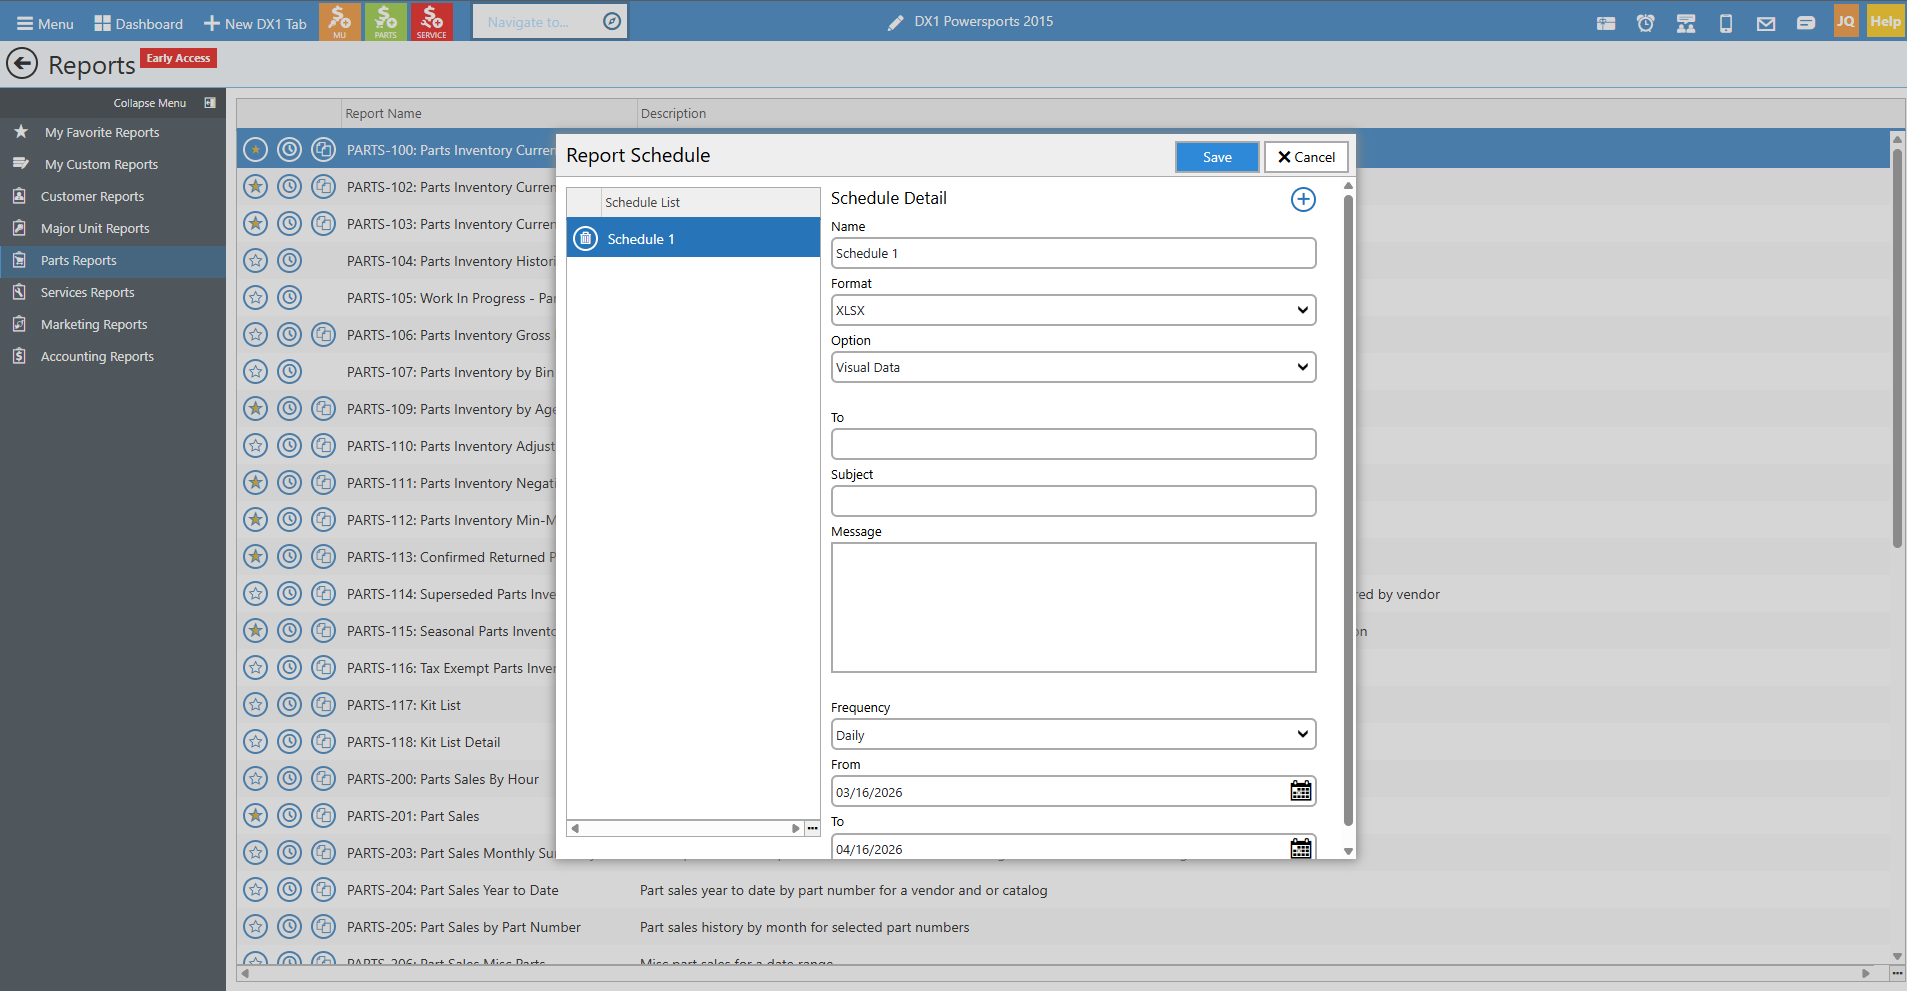
• In the scheduling screen, you can set the following:
- Name: Give your scheduled report a name
- Format: Choose the file format you want to receive (PDF, Excel, etc.)
- Recipients: Enter who should receive the report
- Subject: Set the email subject line
- Message: Add a message to include in the email
- Frequency: Choose daily, weekly, or monthly
- Date Range: Set when the schedule should be active (date from and date to)
• Example uses for scheduled reports:
- Send inventory reports to outside sales reps monthly so they can help identify gaps
- Ensure your sales manager reviews specific reports daily, weekly, or monthly
- Automatically distribute key performance reports to management
• Click Save to activate the scheduled report.
5. How to copy a report
• To copy a report, find the report you want to customize and click the copy icon (two overlapping squares).
• You'll be prompted to give the copied report a name. You can include your name or a date to identify it.
• Add a description for the report if desired.
• Select who the owner of the report should be. The default will always be the user logged in.
• Click Continue.
• The report will open in the report editor, showing real data based on the current information in the system.
• From her,e you can make your customizations (see section 6 for editing details).
• When finished editing, click Save.
• Your custom report will now appear in the My Custom Reports section.
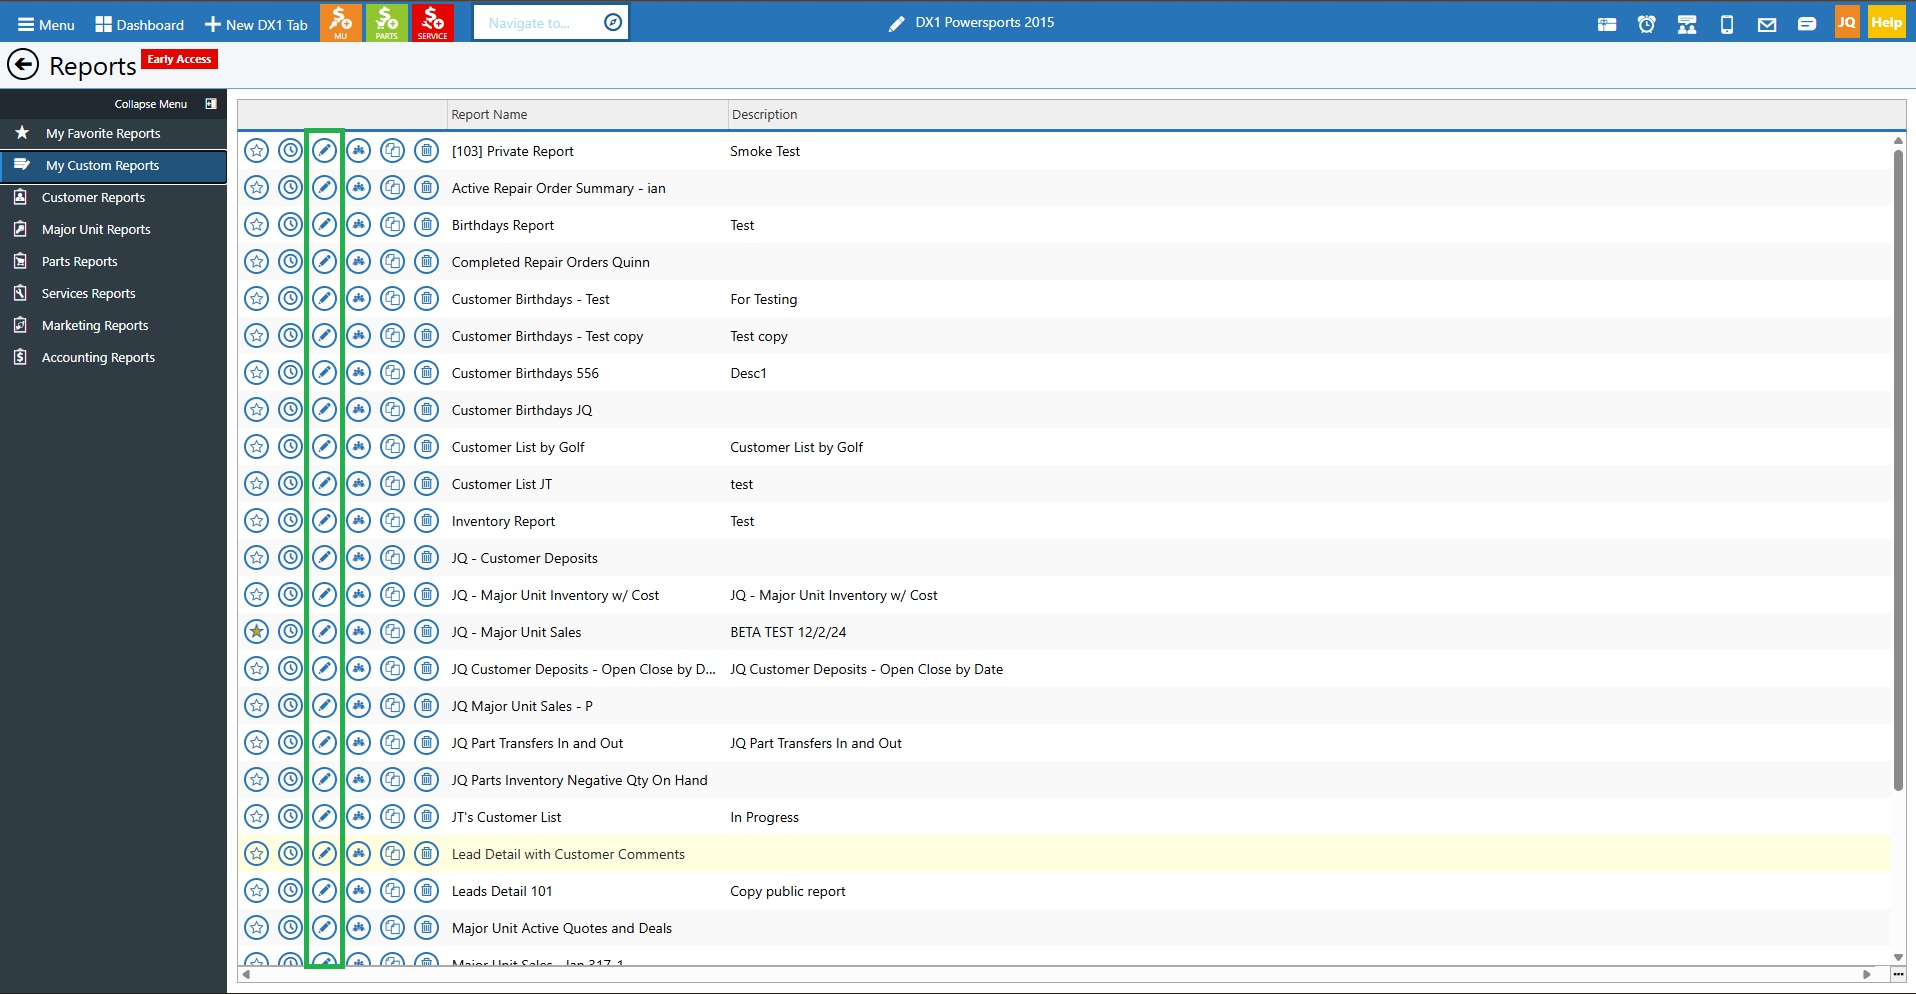
6. How to edit custom reports
• Once you have copied a report, you can edit it by clicking the pencil icon next to the report in your Custom Reports list.
• This will open the report in the editor, where you can make changes.
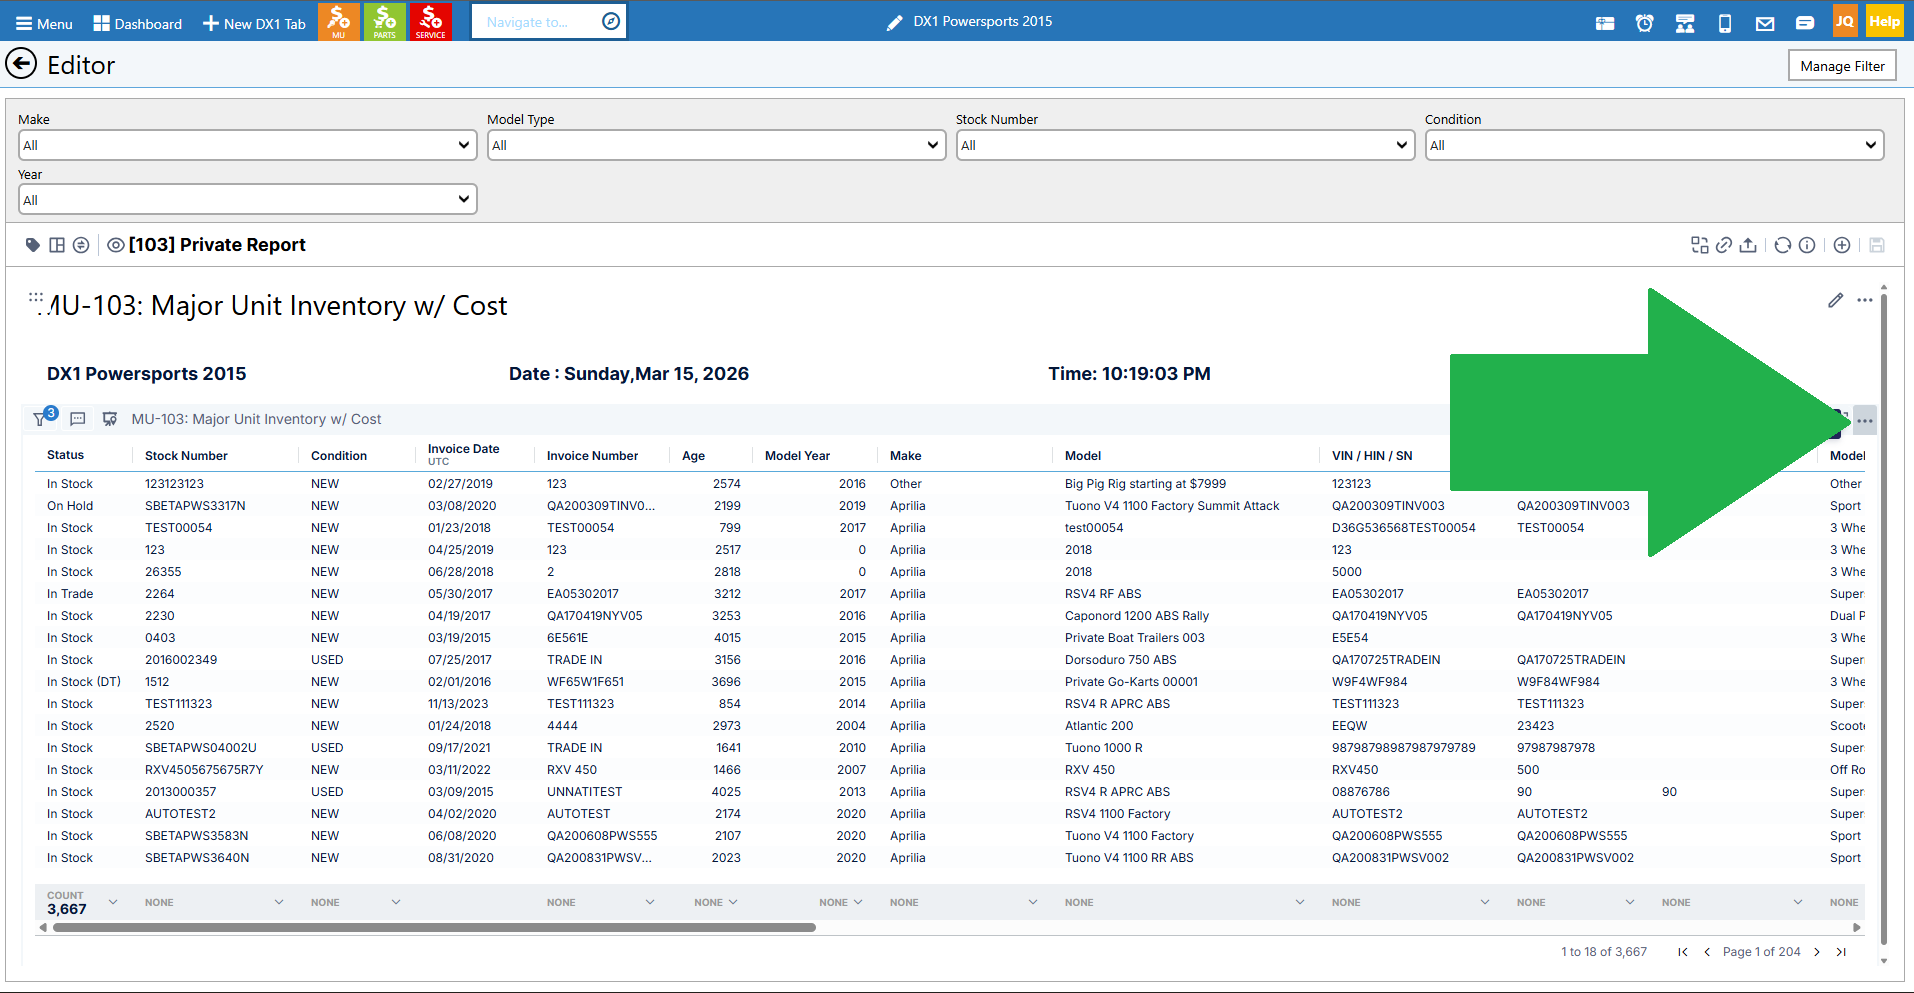
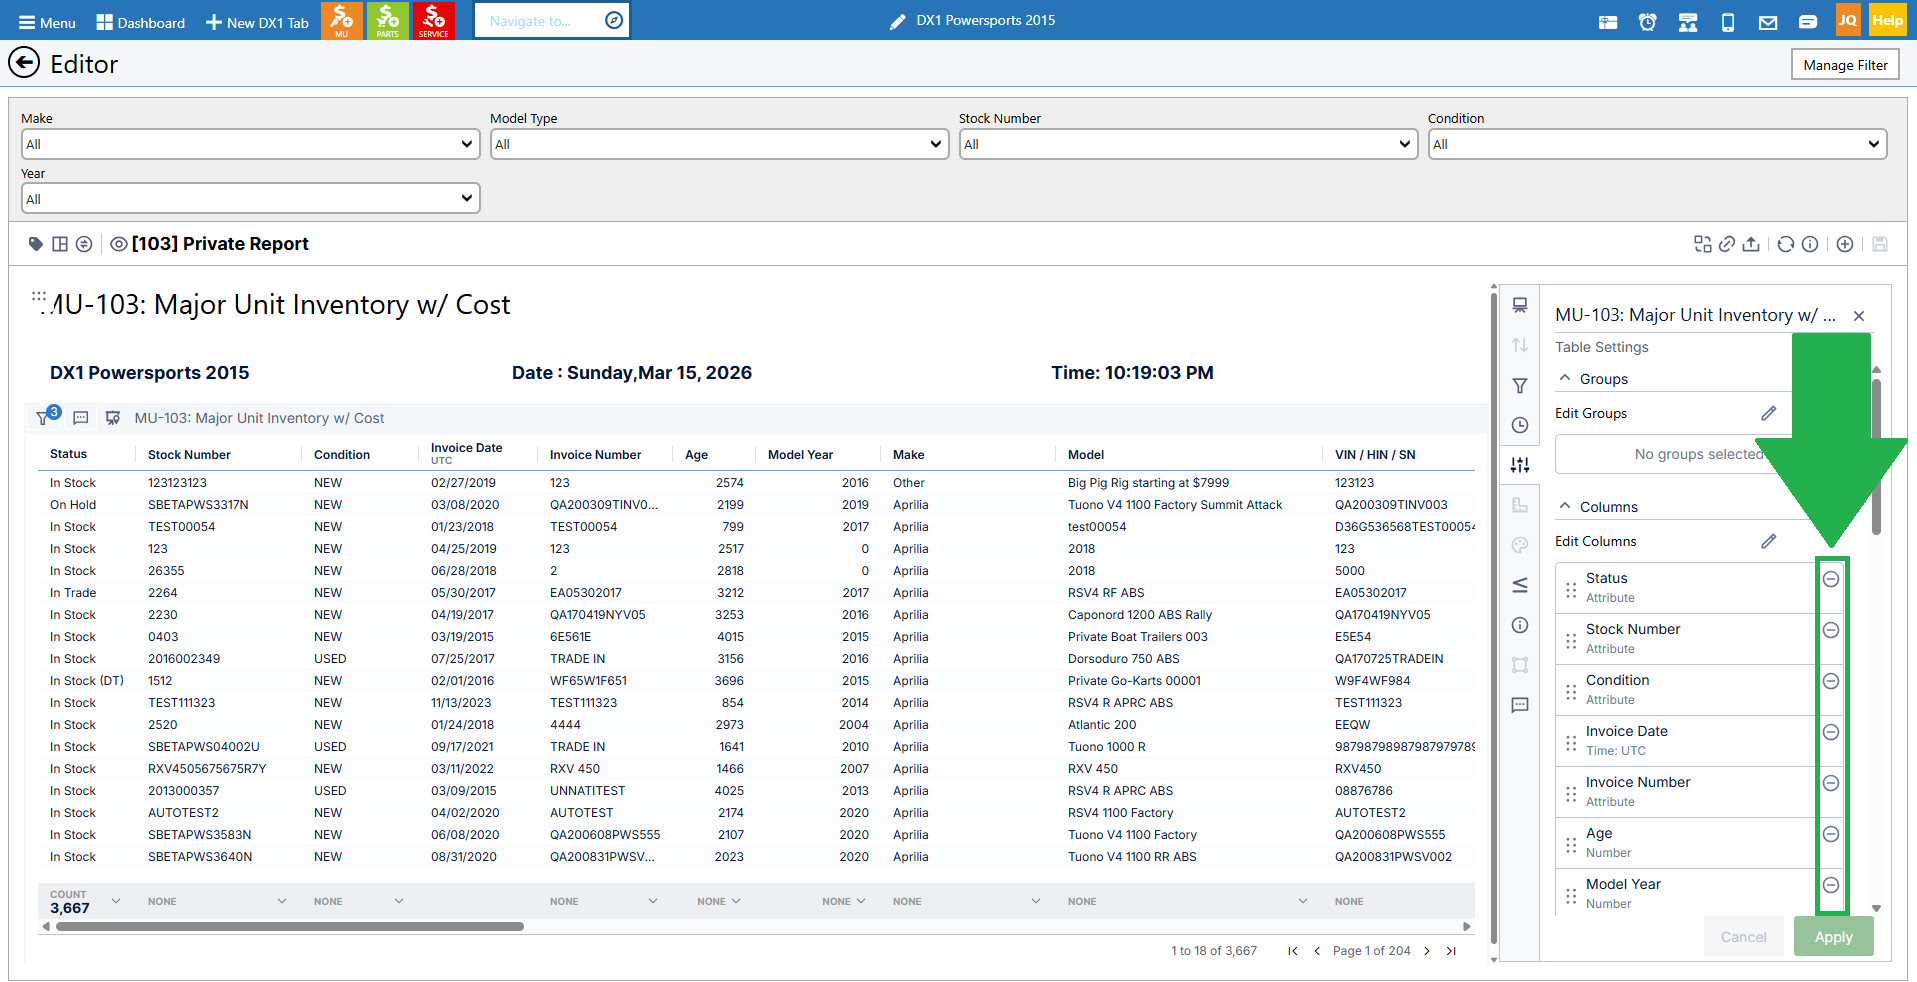
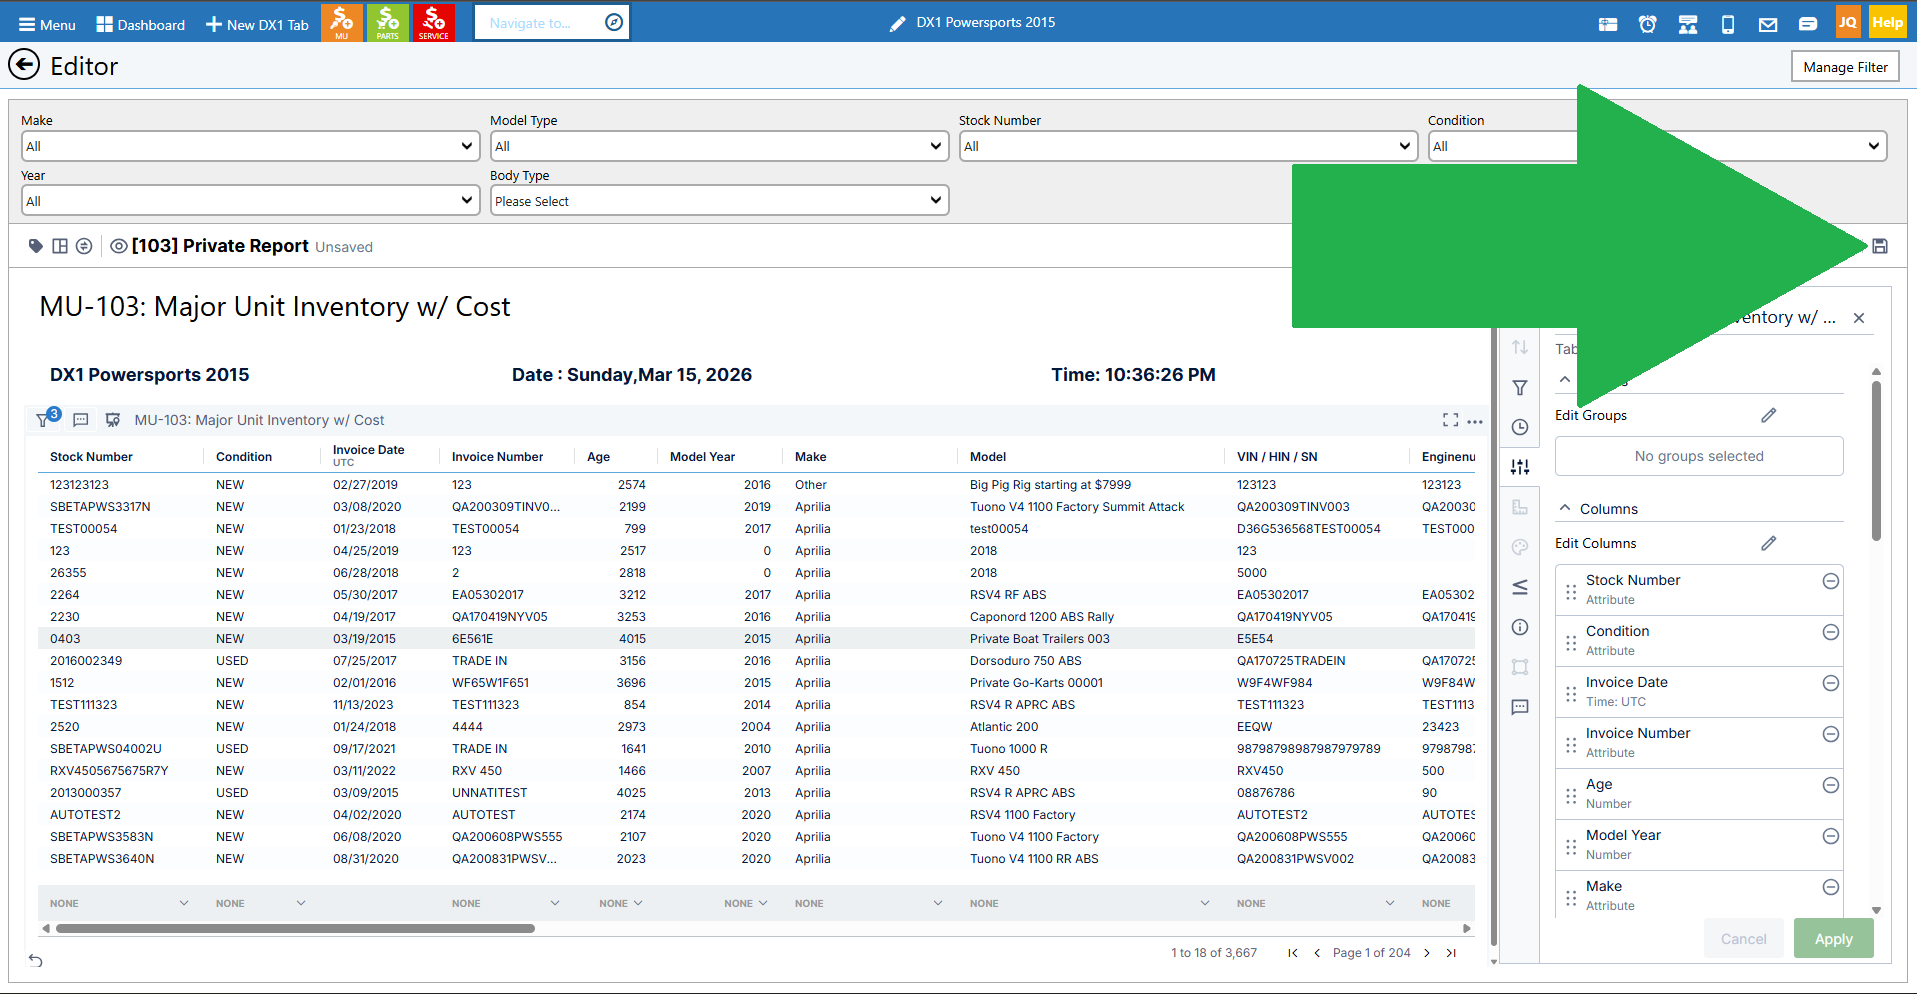
Remove a column
• In the report editor, look for the row with the report name and filter icon.
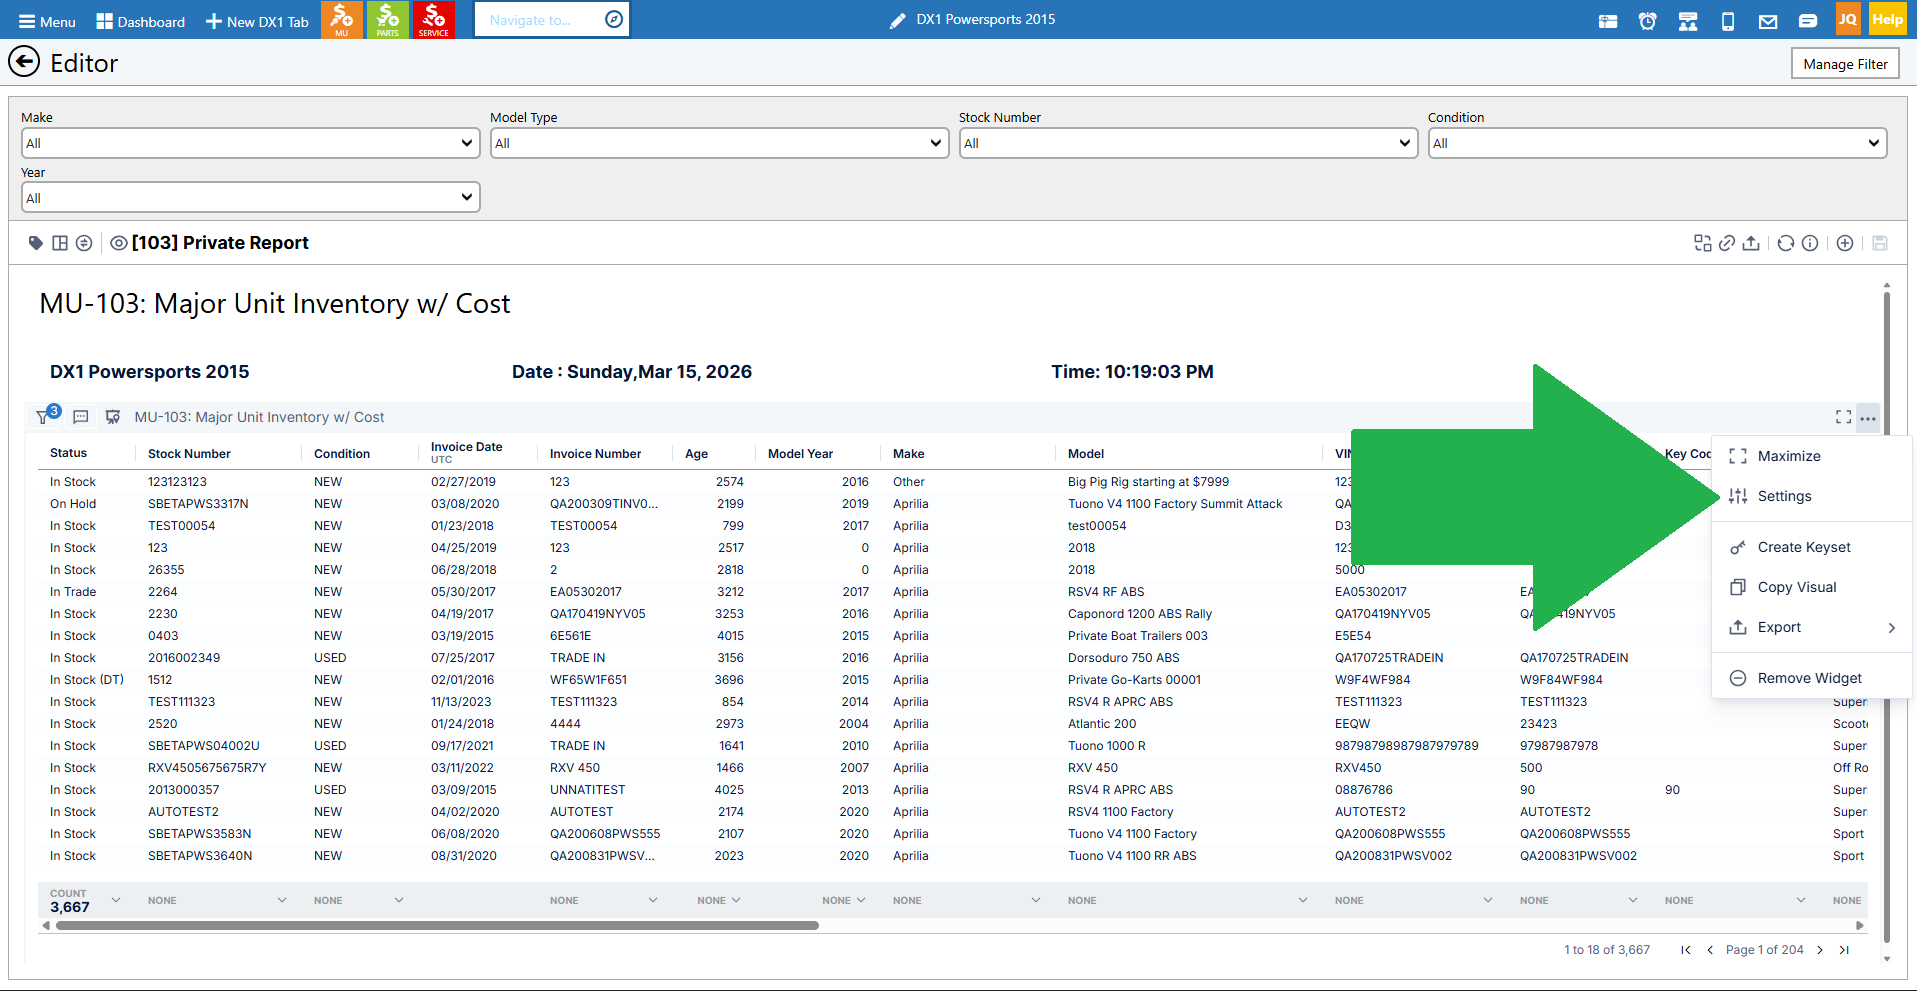
• Click the three dots (triple dots) all the way to the right of that row.
• Click Settings.
• In the navigation bar, click Settings again.
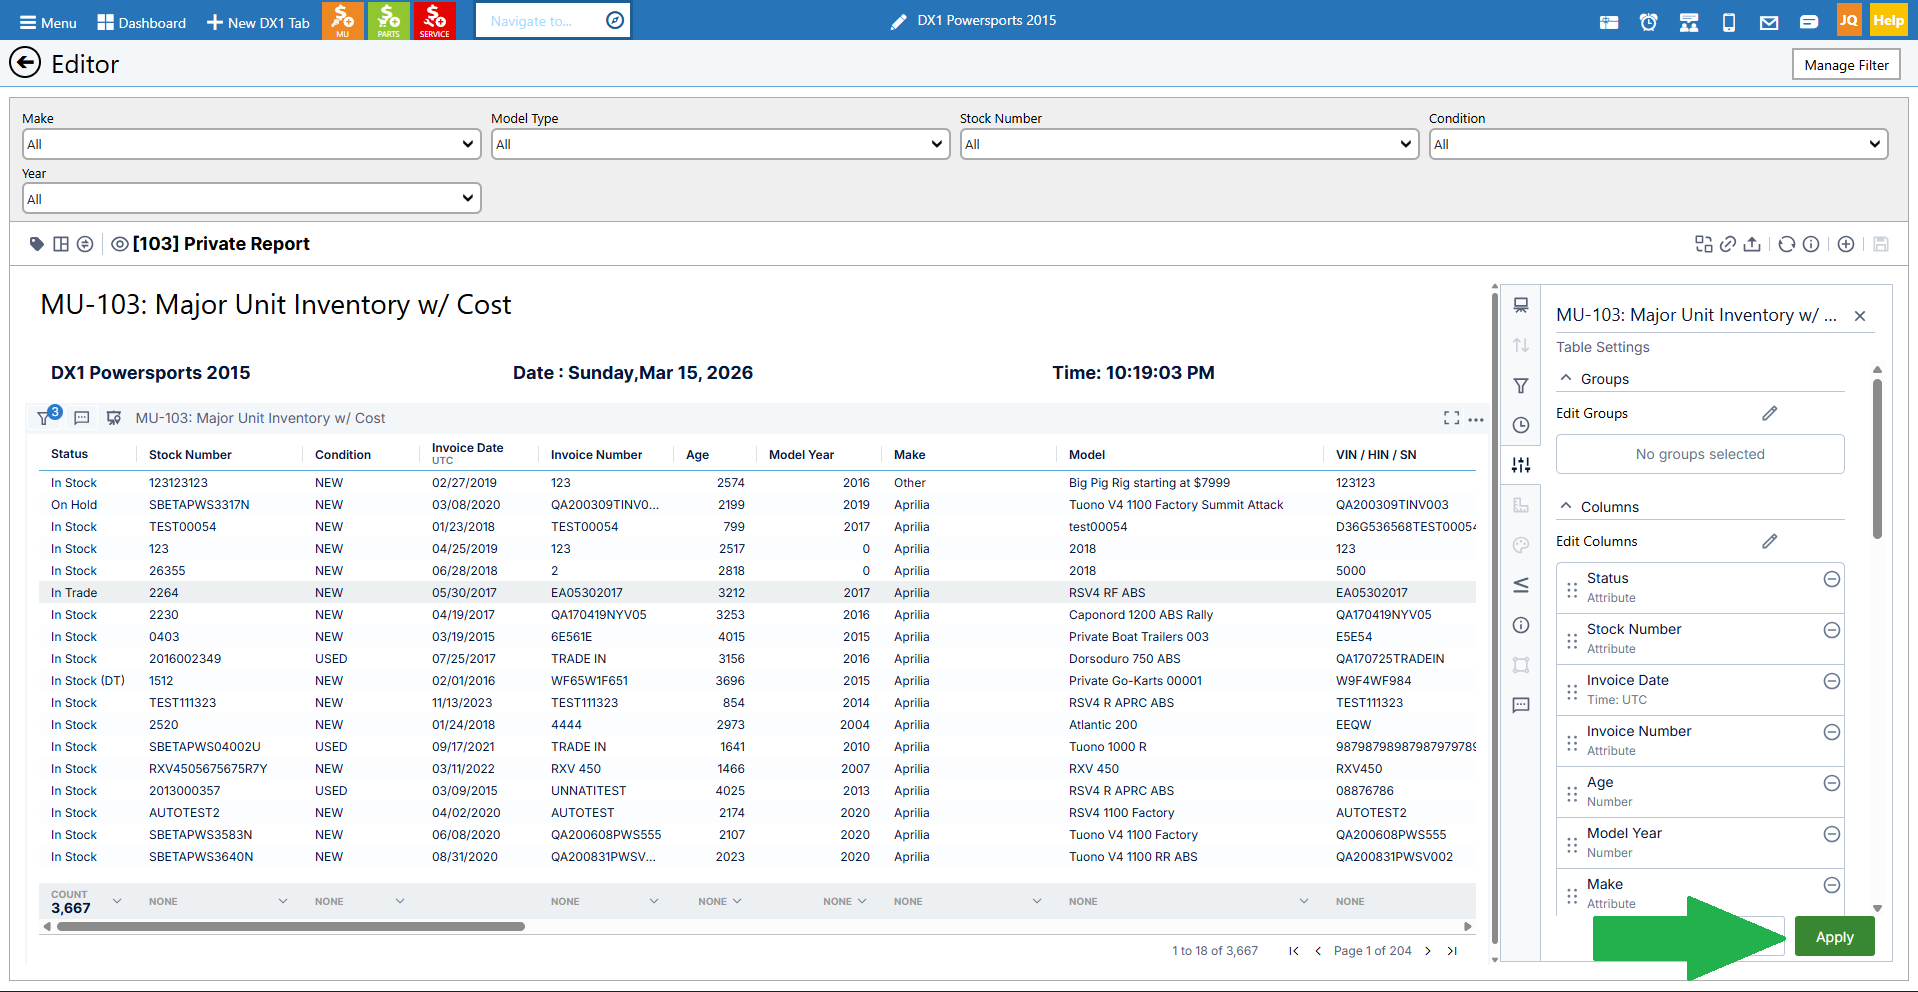
• You'll see a list of all columns currently in the report.
• Find the column you want to remove and click the minus icon next to it.
• Click Apply, and the column will be removed.
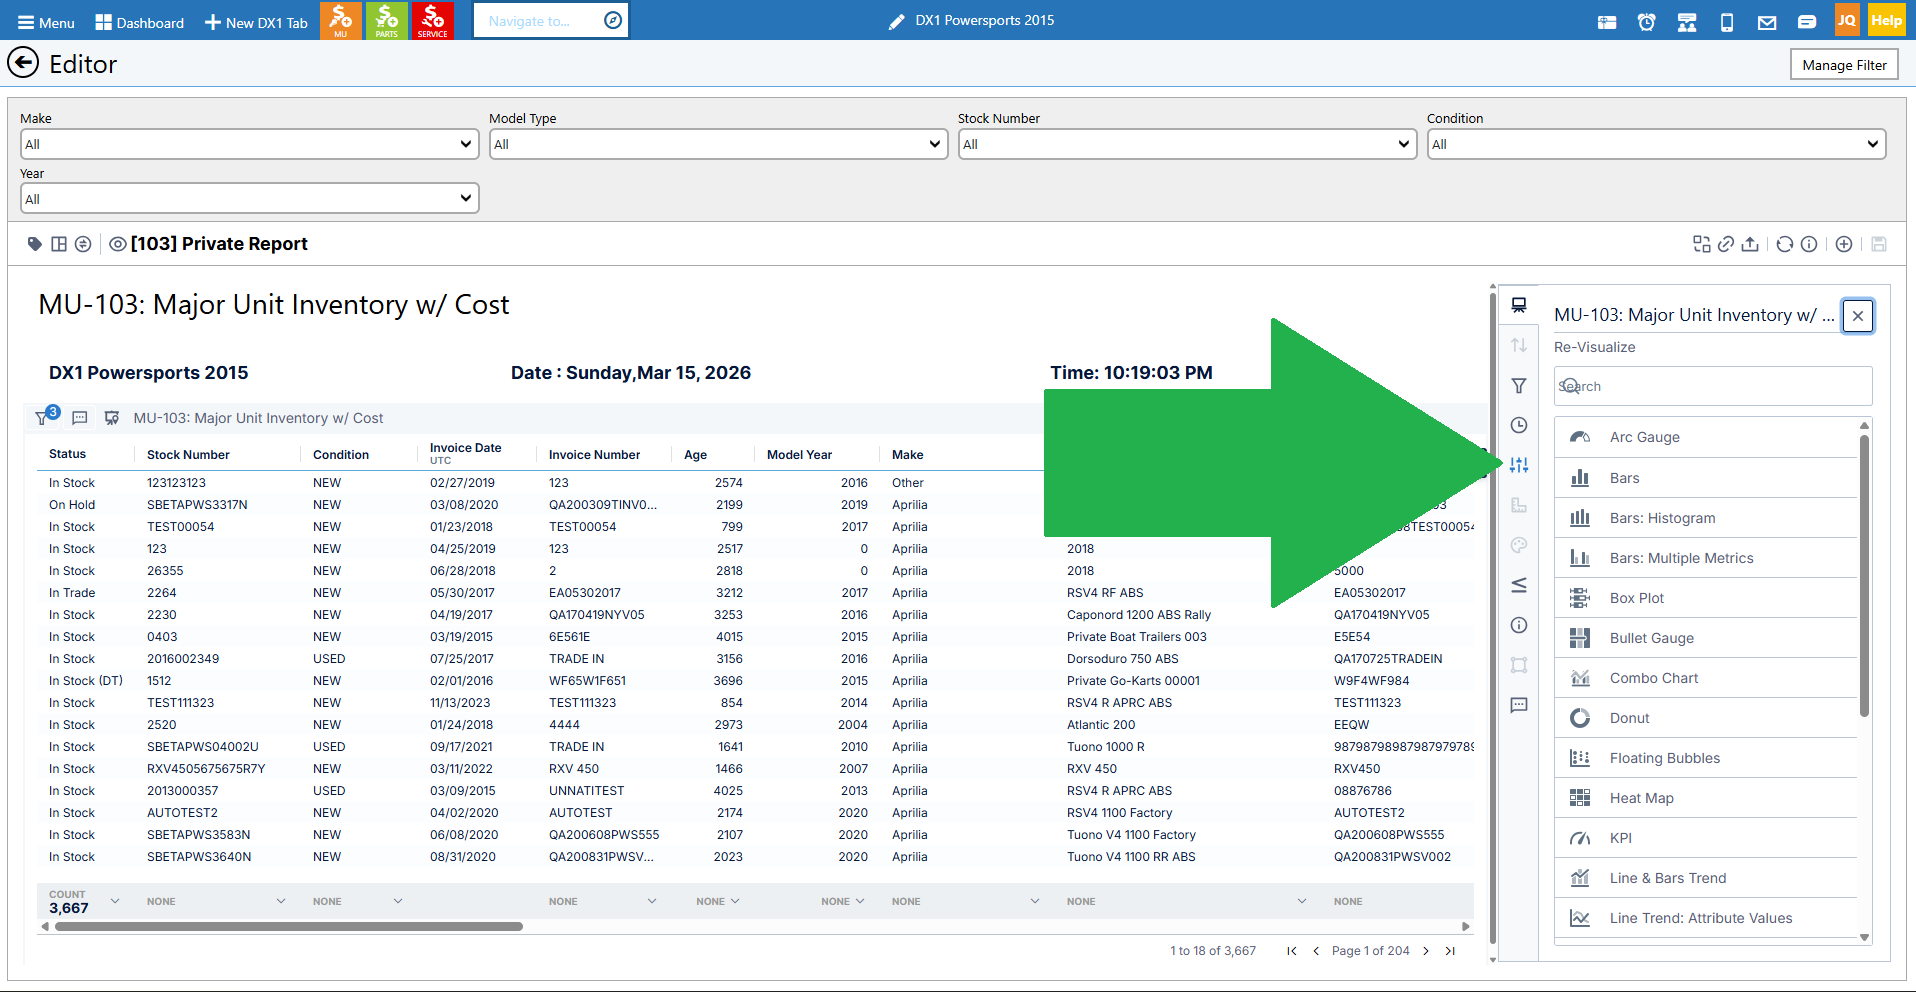
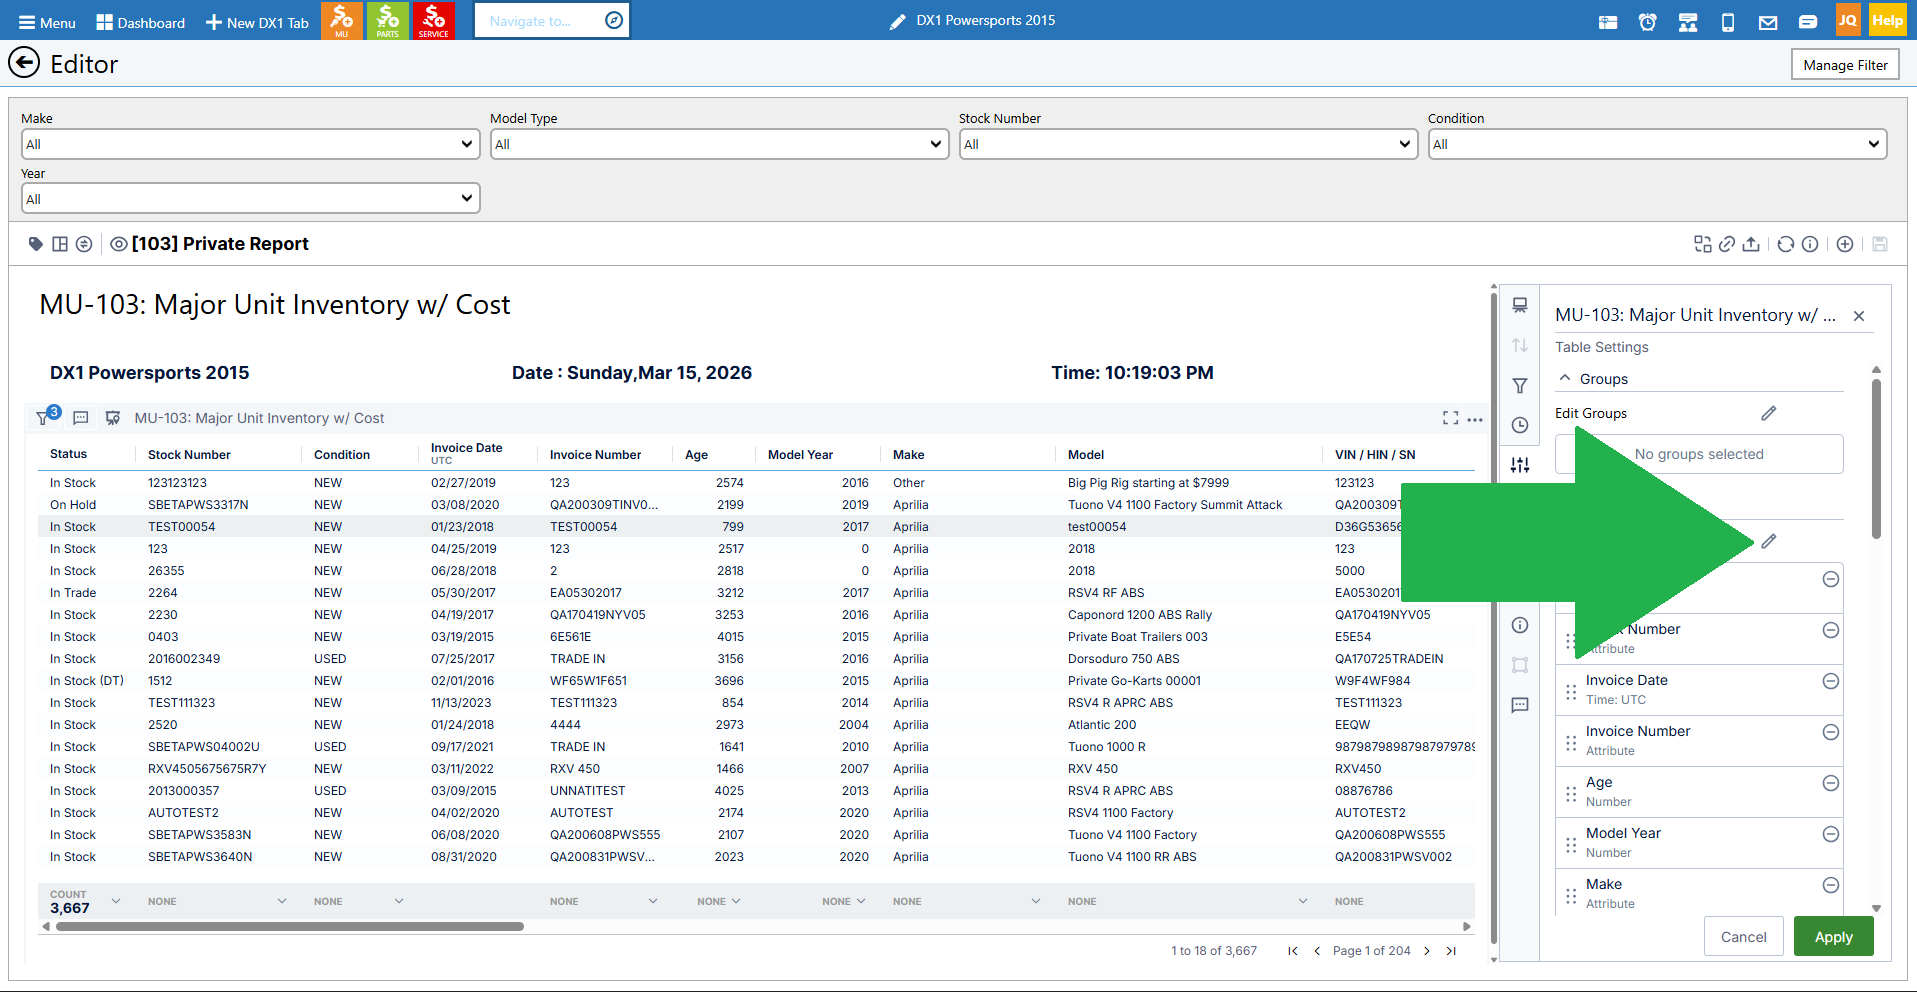
Add a column
• From the Settings screen showing the list of columns, click the pencil icon next to "Edit columns" at the top.
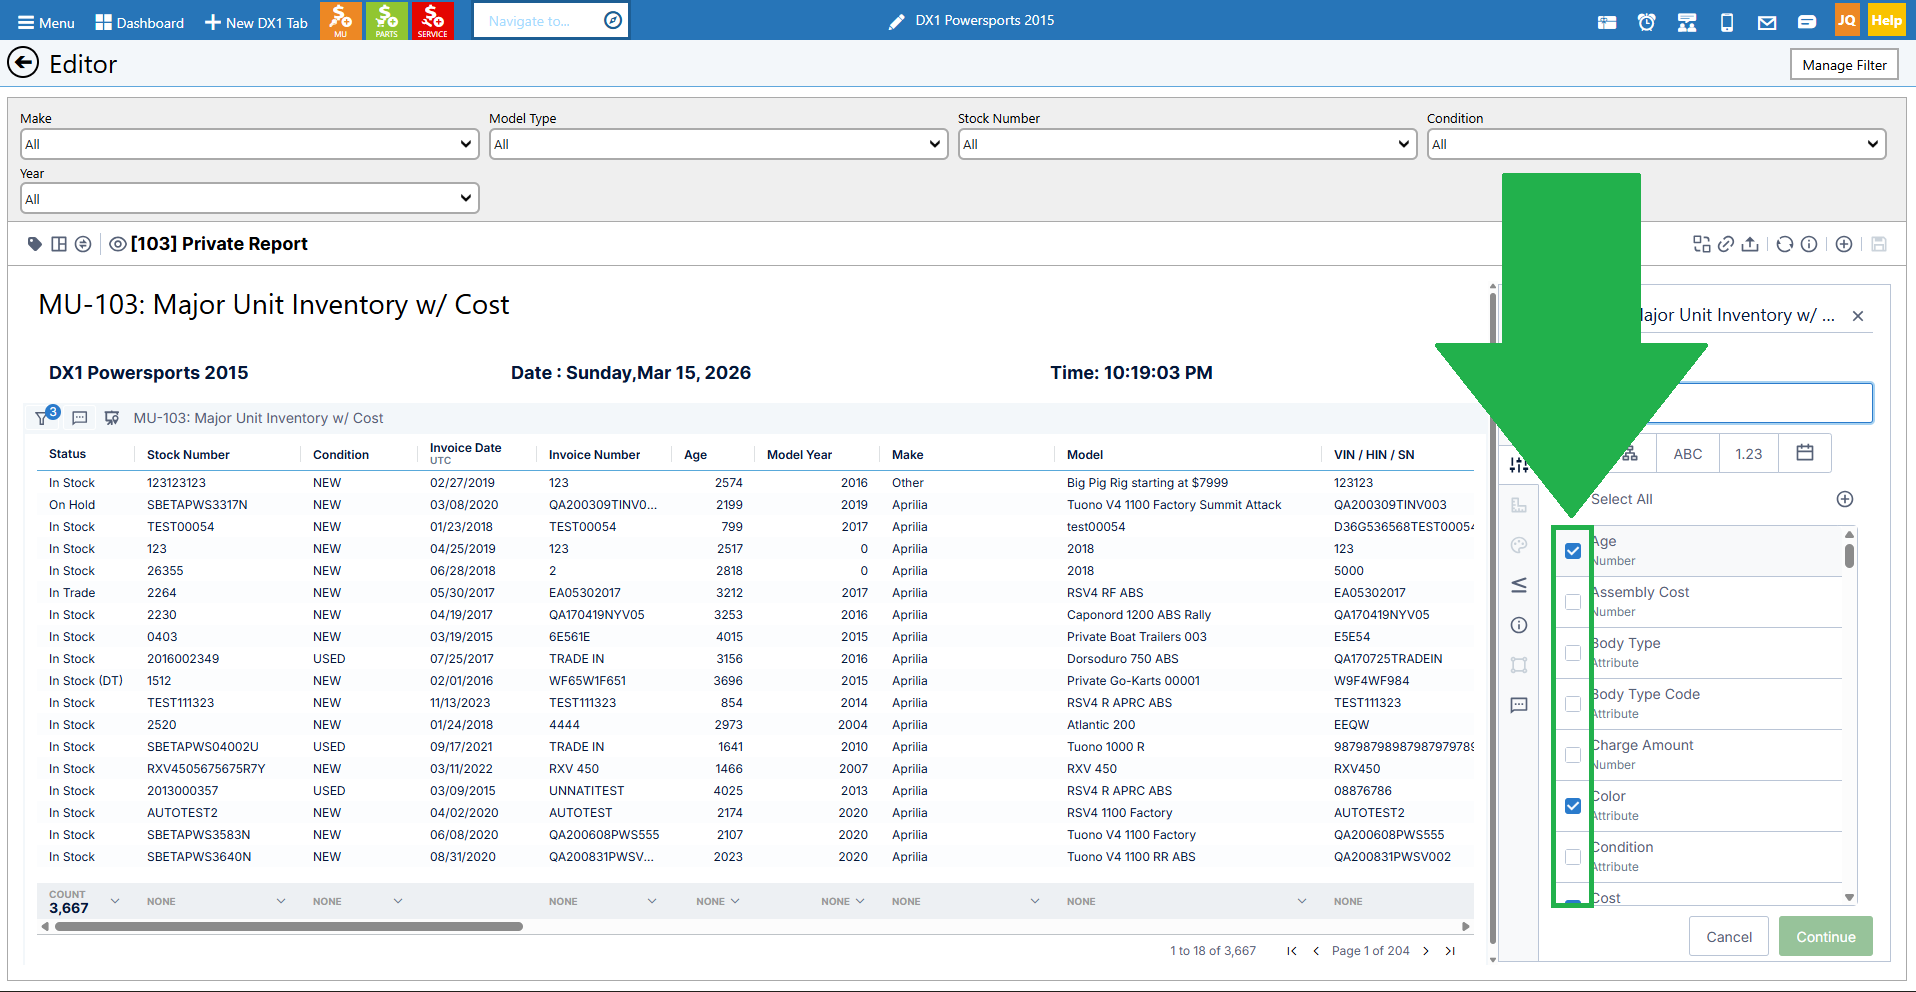
• You'll see all available fields with checkboxes. Fields already in the report will be checked.
• Find the field you want to add and check the box next to it.
• Click Continue.
• Click Apply.
• The new column will be added to your report.
• You can then reorder it by clicking and dragging it to the desired position in the column list.


Organize and move columns
• In the Settings screen with the column list, you can click and drag any column to reorder them.
• For example, if you want Invoice Number before Invoice Status, click Invoice Number, drag it to the new position, and click Apply.
• You can also adjust column widths in the report view by clicking and dragging the column borders, similar to Excel or Google Sheets.
Set the Sort Order
• In the column list, you'll notice numbers (1, 2, etc.) on top of some columns. These indicate the sort order.
• The default sort might be by Invoice Date (1) and then Invoice Number (2).
• To add a third sort, find the column you want and click it. A number 3 will appear.
• Click the sort number to toggle between ascending and descending order.
• To remove a sort, click the sort number a third time, and it will disappear.
• Click Apply to save your sort order changes.
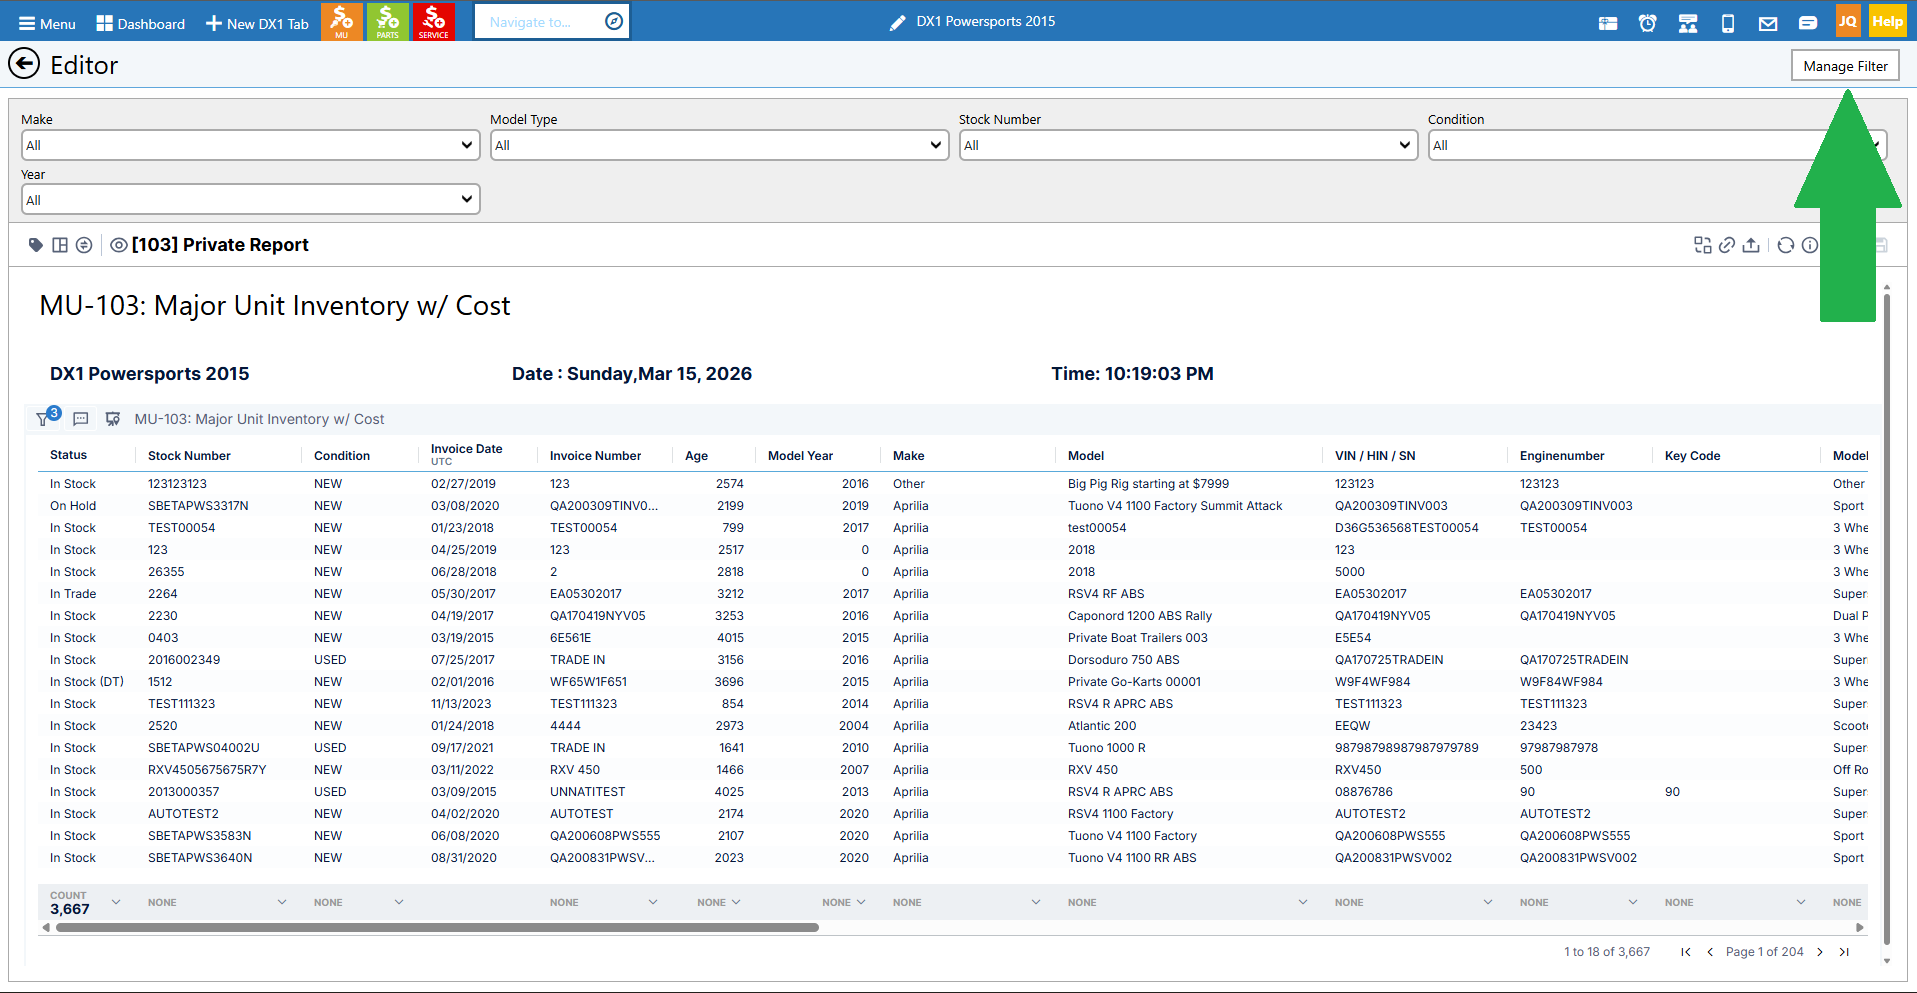
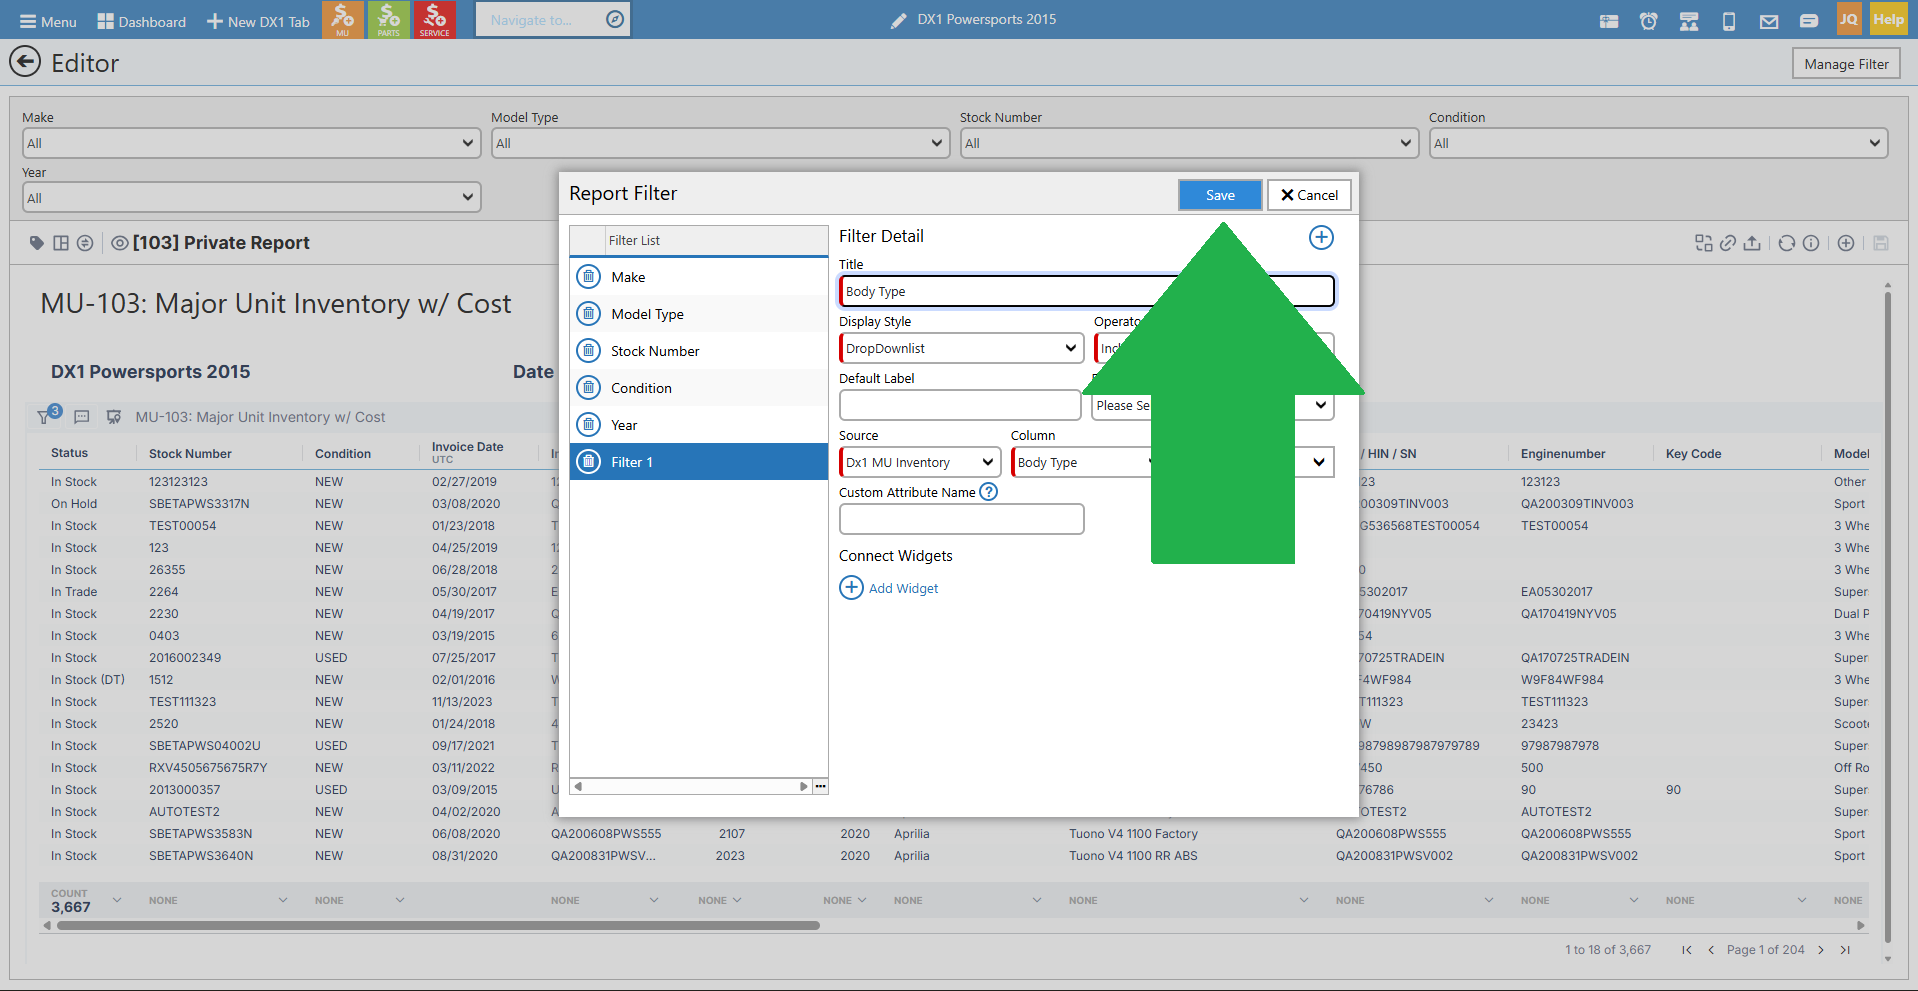
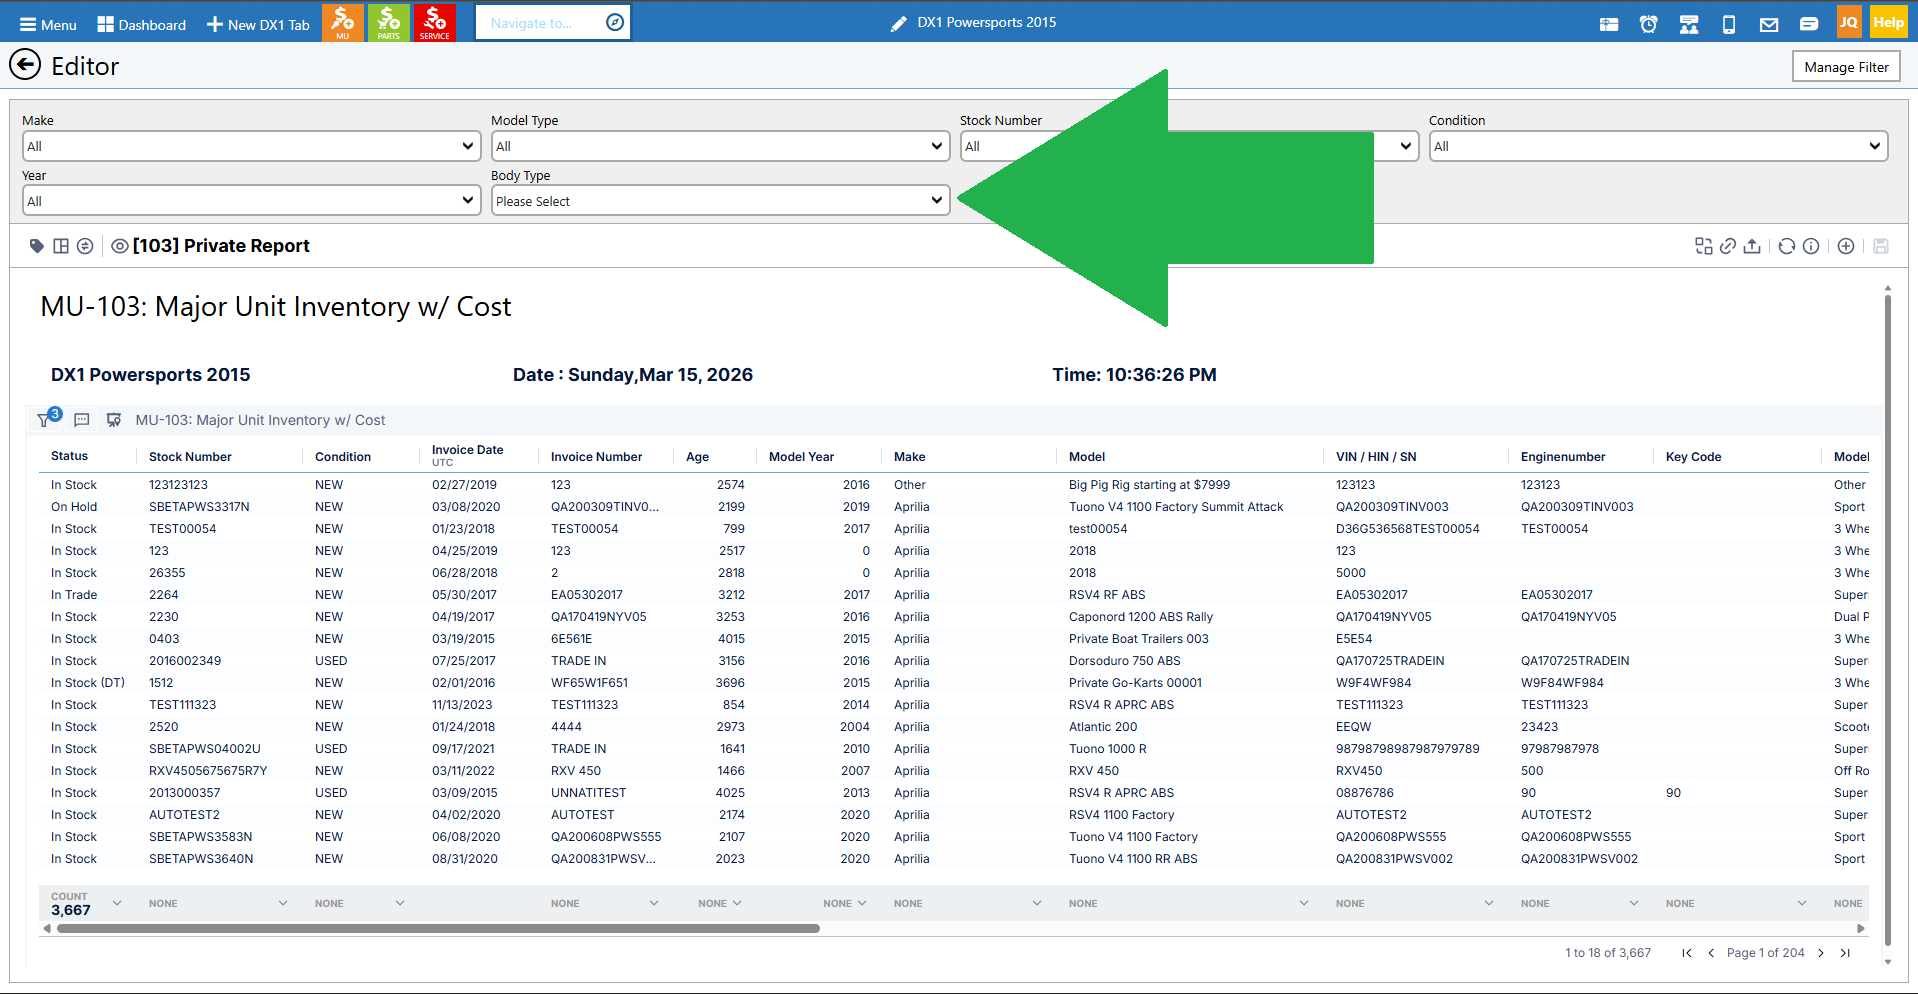
Add or change a filter
• Filters can be applied to narrow down the data shown in your report.
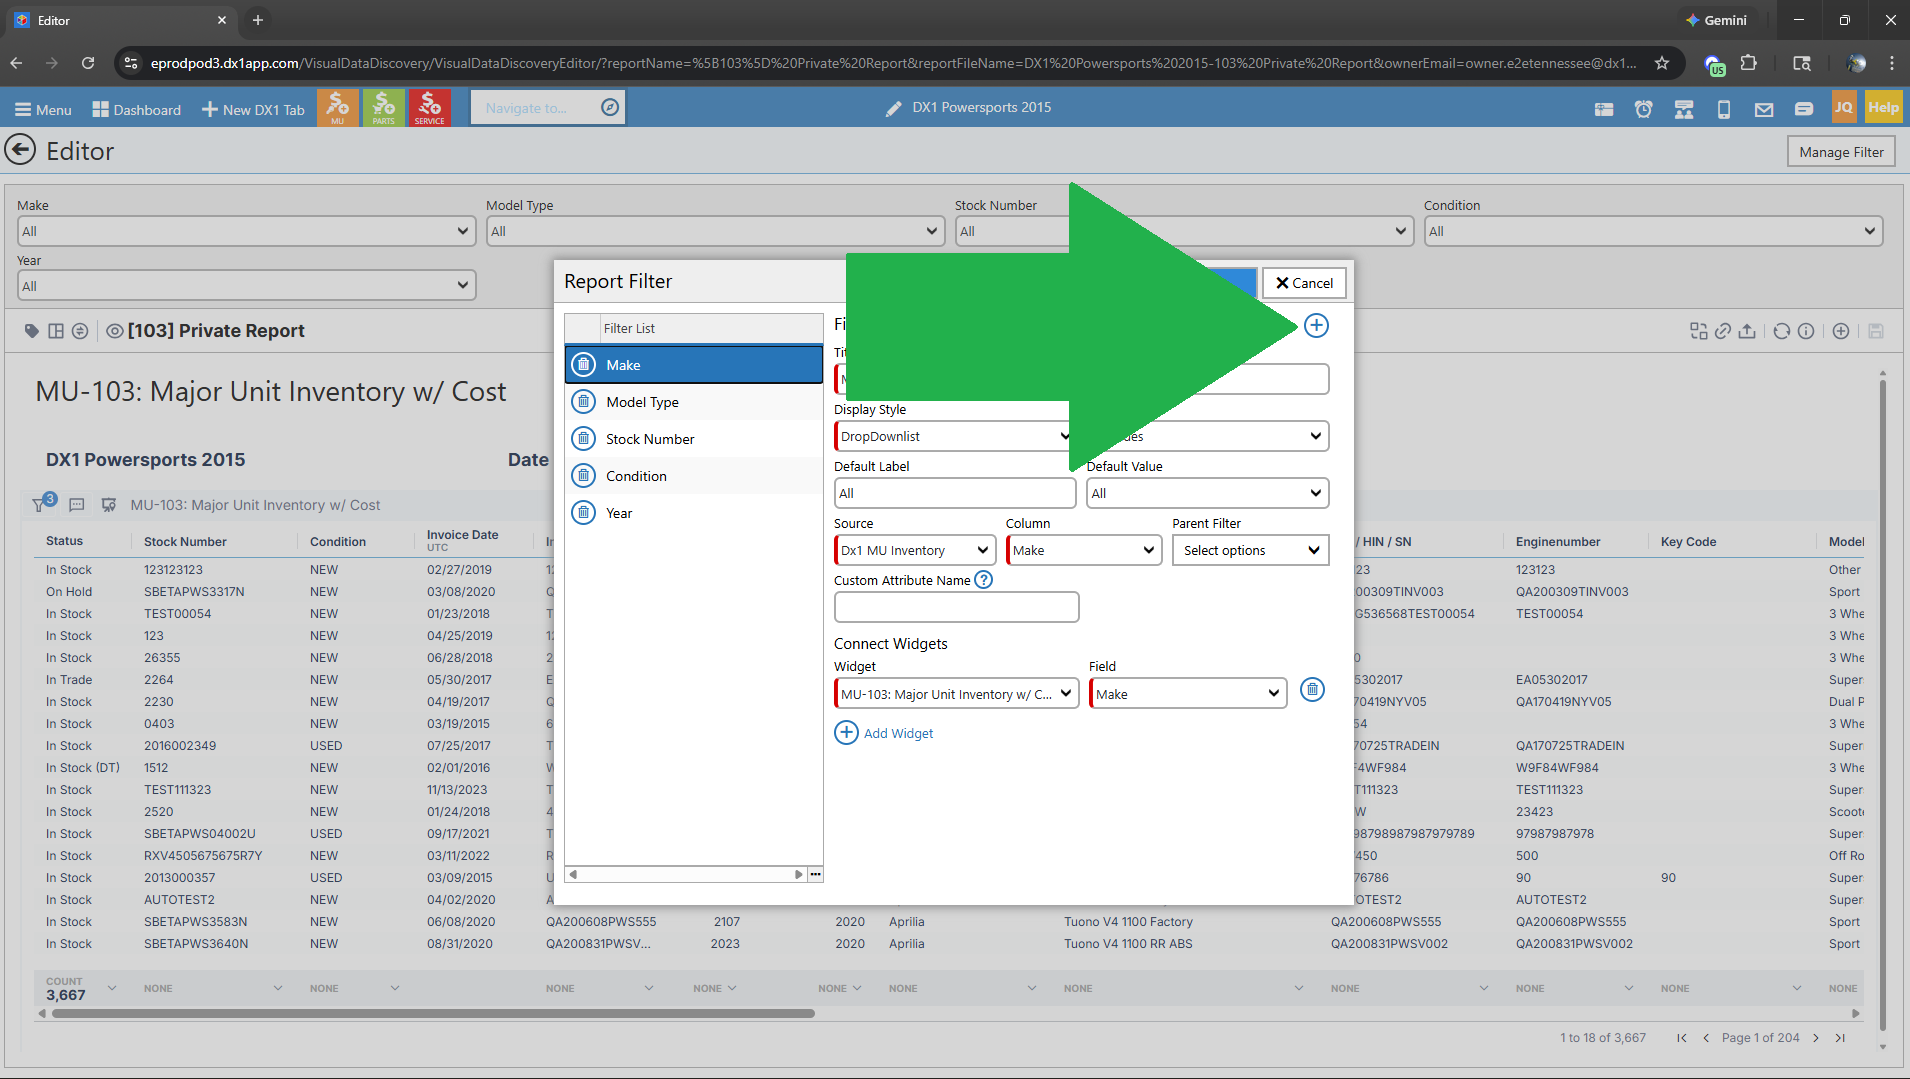
• Click the filter icon in the report header.
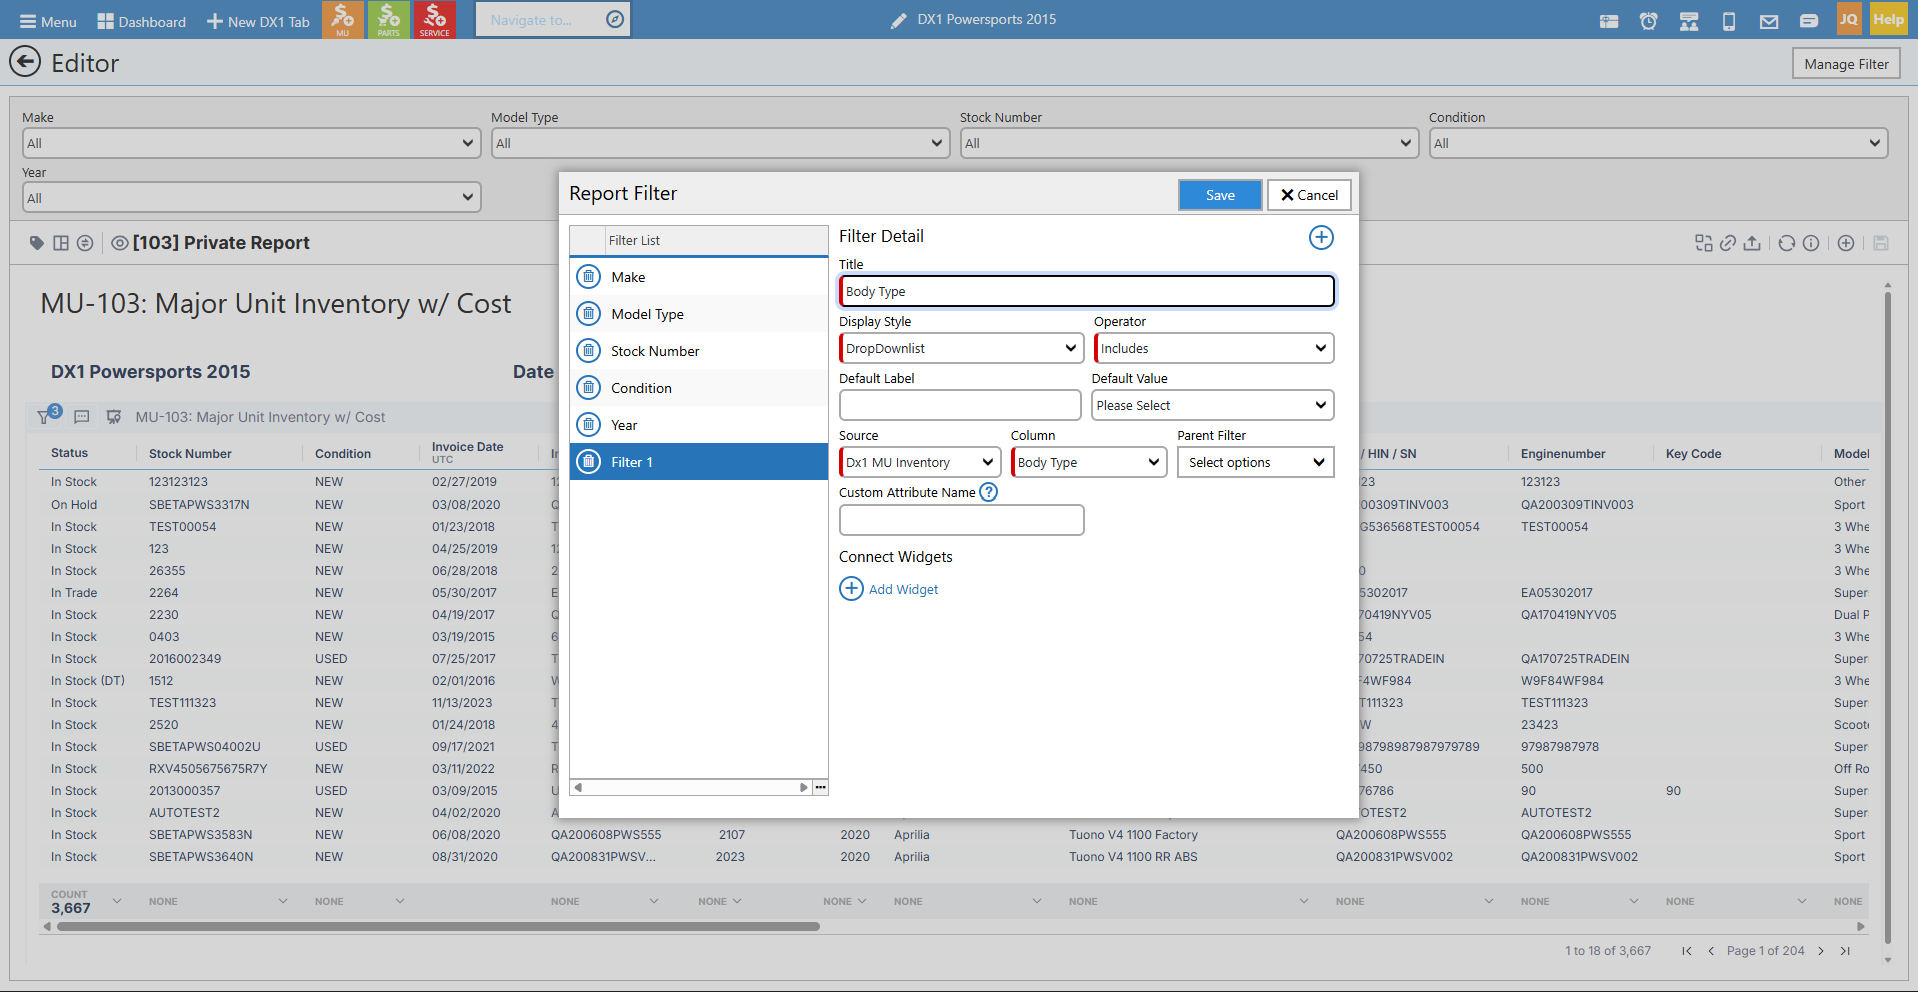
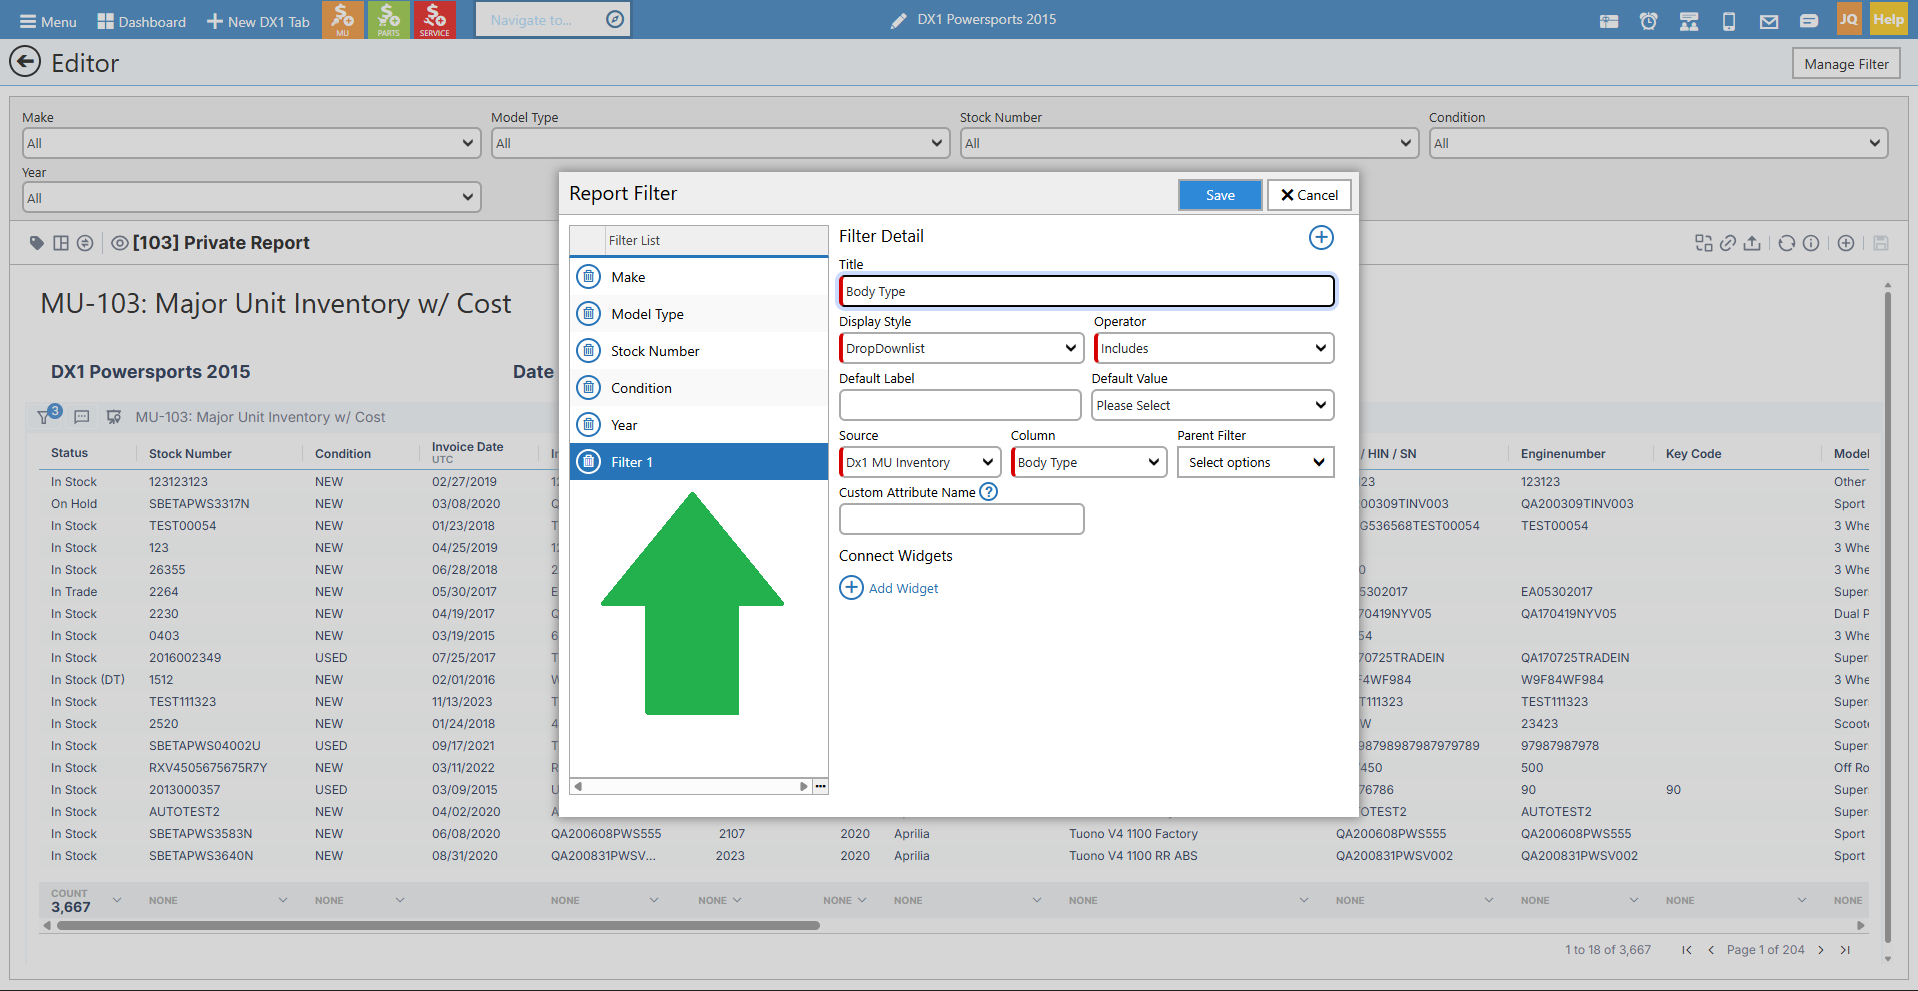
• Select the field you want to filter by.
• Set your filter criteria (equals, contains, greater than, etc.).
• Enter the filter value.
• Click Apply to activate the filter.
• You can add multiple filters to further refine your report data.
Save your changes
• Once you've made all your desired changes (added columns, removed columns, set sorting, applied filters), click Save.
• The report will be saved under the name you gave it.
• You can run test searches right from the editor to verify your changes.
• When you leave the editor, your custom report will appear in the My Custom Reports section.
Additional custom report options
• Mark as Favorite: You can mark your custom report as a favorite so it appears in your favorites list.
• Schedule: You can schedule your custom report just like any public report.
• Edit: Click the pencil icon to return to the editor and make changes.
• Assign Access: You can control who has access to your custom report by clicking the access icon. You can give users Read, Read and Modify, or Full Access permissions.
• Copy: You can copy a custom report to create another version.
• Delete: You can delete custom reports you no longer need.
7. Don't miss reports by department
The following section highlights key reports in each department that you should be aware of and explore.
Customer Reports
• Customer Sales History (Customer 106): A critical report for understanding customer purchasing patterns. Important for marketing, identifying trade-in opportunities, and quickly reviewing a customer's sales history.
• Lead Details / Lead State Summary: Shows where leads are in the sales process. Helps you understand if you're converting leads and if you're doing what needs to be done.
• Testimonials and Surveys: Track customer feedback and satisfaction.
• CRM Scoreboard and Scoreboard Detail: Reports related to your road to sale process and KPIs for tracking lead management performance.
Major Unit Reports
• Major Unit Inventory Count (MU-100 series): Critical for understanding what you have in stock. You can view it with and without cost information.
• Historic Valuations: Allows you to see what your inventory value was on a specific date in the past (useful for end-of-year reporting).
• Active Quotes and Deals: Shows all open quotes and deals in progress.
• Major Unit Sales: Provides detailed information on unit sales.
• Major Unit Fees: Shows types of fees collected during a date range (important for fee payouts).
• Commissions: Track commission data for sales.
• Major Unit Sales History: View sales history for individual units or users.
• Major Unit Sales Follow-up: Lists units that have been sold but haven't come back for follow-up service work. Great for identifying why customers aren't returning and improving customer retention.
Parts Reports
• Parts Inventory (Parts 100 series): View inventory by part number, vendor, or category.
• Historic Valuation: See your parts inventory value on the last day of the year or any specific date.
• Parts Inventory Searches: Multiple search options to find and analyze parts inventory.
• Correct Negative On Hand: An important report for identifying and correcting parts with negative quantities. This is NOT done through the parts physical inventory process. You can print this report and assign someone to clean up the negative quantities in the system. Consider using a smart notification for this task.
• Min/Max Settings: Review where your min/max levels are set for parts reordering.
• Return Parts from Other Departments: When parts aren't being returned from service or other departments, this report helps identify patterns. Is it a specific technician or service writer who isn't returning parts? Use this to find the root cause.
• Parts Sales Reports (Parts 200 series): Part Sales 2011 is a major report where you can set date ranges and break down sales by month, year-to-date, or by part number.
• Kit Sales and Serialized Sales: Specialized sales reports for kits and serialized parts.
• Lost Sales Parts: Shows parts marked as lost sales that haven't been ordered yet.
• Backordered Parts: Critical report for tracking parts on backorder.
• Open Stock Orders: View outstanding special orders for customers.
Service Reports
• Performance Metrics Report: A KPI dashboard that gives you a quick snapshot of service department performance. Rather than running multiple reports, you can get much of your key information in one place.
• Open Work Estimates: View all open estimates.
• Active Repair Orders: See all active ROs. This can also be accessed through the active list using drill-down search.
• Technician Reports: Critical for managing technician pay, whether flat rate, commission, or other pay structures. These reports help you track and pay for jobs accurately.
• Completed Jobs vs. Posted ROs: Note that when an RO is completed, it shows in reporting, but if you mark a job as completed, it may not show in reporting until the RO is closed. DX1 has specific reports that show information for completed jobs without the RO being posted.
• Technician Wasted Time: Important report for tracking non-productive time.
• Upcoming Service Appointments: Quick snapshot of scheduled service appointments.
• View Service History by VIN: Look up complete service history for a specific unit.
• Major Unit Sales without Customer Service History: Identifies customers who bought units but haven't brought them back for service. Great for follow-up and retention efforts.
Marketing Reports
• Marketing reports are fewer in number but highly valuable for understanding marketing effectiveness.
• MAP Violations: If you're dealing with Manufacturer's Advertised Price (MAP) violations, this report helps flag pricing rule violations set by manufacturers.
Accounting Reports
• Business Summary: Brings together data from all departments into one easy-to-digest view. Instead of running three reports per department, you can see sales for a period across all areas.
• Major Units, PGA Stats, Retail Invoices: Consolidated sales information.
• Composite Reports: Comprehensive financial overviews.
• Revenue Summaries: Track revenue across categories.
• Sales Tax Liability, Tax Rates: Critical for tax reporting and compliance.
• Journal Entries: Detailed accounting transaction reports.
• Payment Detail Reports: When you need to track down a wrong payment method or backtrack to find where something went wrong at the end of the day, use this report to see a list of payments taken.
• Search Charge Revenue: Understand the type of revenue generated from search charges.
• Time Clock Reports: Both detailed and summary time clock reports for employee hours.
• Top Customers, Top Sold Parts: Identify your best customers and best-selling parts to inform business decisions.
Final Note on Reports
• DX1 has compiled these reports over many years, working with dealers to provide the information needed to run a better business.
• Take time to explore all reports in each department.
• Play with the data, understand what each report does, and identify which reports are most valuable for your specific dealership needs.
• Don't be afraid to create custom versions of reports to fit your exact requirements.